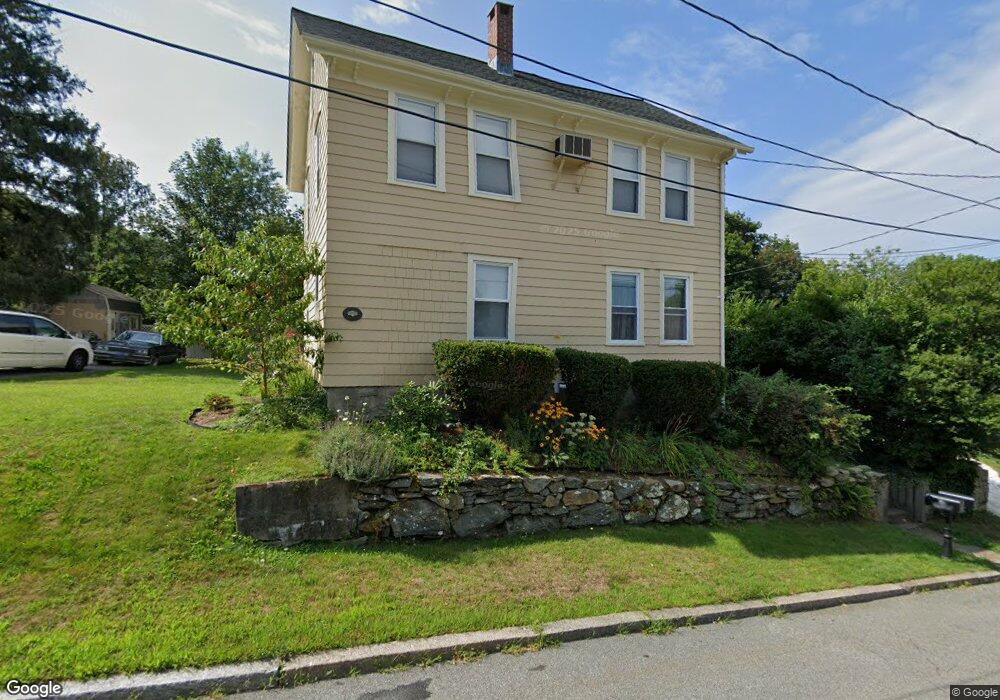
83 Holland St Unit 1 Fall River, MA 02720
Western Fall River NeighborhoodEstimated Value: $334,897 - $428,000
1
Bed
1
Bath
800
Sq Ft
$452/Sq Ft
Est. Value
About This Home
This home is located at 83 Holland St Unit 1, Fall River, MA 02720 and is currently estimated at $361,474, approximately $451 per square foot. 83 Holland St Unit 1 is a home located in Bristol County with nearby schools including North End Elementary School, Morton Middle School, and B M C Durfee High School.
Ownership History
Date
Name
Owned For
Owner Type
Purchase Details
Closed on
Oct 5, 2012
Sold by
Foti Kevin
Bought by
Foti Patricia A
Current Estimated Value
Purchase Details
Closed on
Mar 8, 2011
Sold by
Northen Star Llc
Bought by
Fall River Holdings Ll
Purchase Details
Closed on
Jan 11, 2010
Sold by
Wells Fargo Bk
Bought by
Department Of Housing & Urban Dev
Purchase Details
Closed on
Dec 11, 2009
Sold by
Medeiros Darren
Bought by
Wells Fargo Bk
Purchase Details
Closed on
Apr 13, 2001
Sold by
Needham Bessie
Bought by
Lubin-Silvia Allison B and Silvia Mark J
Home Financials for this Owner
Home Financials are based on the most recent Mortgage that was taken out on this home.
Original Mortgage
$158,746
Interest Rate
6.97%
Mortgage Type
Purchase Money Mortgage
Create a Home Valuation Report for This Property
The Home Valuation Report is an in-depth analysis detailing your home's value as well as a comparison with similar homes in the area
Home Values in the Area
Average Home Value in this Area
Purchase History
| Date | Buyer | Sale Price | Title Company |
|---|---|---|---|
| Foti Patricia A | -- | -- | |
| Fall River Holdings Ll | -- | -- | |
| Northen Star Llc | $95,000 | -- | |
| Department Of Housing & Urban Dev | -- | -- | |
| Wells Fargo Bk | $432,172 | -- | |
| Lubin-Silvia Allison B | $160,000 | -- |
Source: Public Records
Mortgage History
| Date | Status | Borrower | Loan Amount |
|---|---|---|---|
| Previous Owner | Lubin-Silvia Allison B | $158,746 |
Source: Public Records
Tax History Compared to Growth
Tax History
| Year | Tax Paid | Tax Assessment Tax Assessment Total Assessment is a certain percentage of the fair market value that is determined by local assessors to be the total taxable value of land and additions on the property. | Land | Improvement |
|---|---|---|---|---|
| 2025 | $3,191 | $278,700 | $114,800 | $163,900 |
| 2024 | $2,971 | $258,600 | $112,500 | $146,100 |
| 2023 | $2,771 | $225,800 | $101,400 | $124,400 |
| 2022 | $2,587 | $205,000 | $95,700 | $109,300 |
| 2021 | $2,415 | $174,600 | $91,400 | $83,200 |
| 2020 | $2,221 | $153,700 | $87,200 | $66,500 |
| 2019 | $2,222 | $152,400 | $91,200 | $61,200 |
| 2018 | $2,170 | $148,400 | $91,800 | $56,600 |
| 2017 | $2,031 | $145,100 | $91,800 | $53,300 |
| 2016 | $2,000 | $146,700 | $94,700 | $52,000 |
| 2015 | $1,937 | $148,100 | $94,700 | $53,400 |
| 2014 | $1,923 | $152,900 | $94,700 | $58,200 |
Source: Public Records
Map
Nearby Homes
- 104 Corbett St
- 2022-2030 Highland Ave
- 172 Gibbs St
- 3216 N Main St
- 3226 N Main St Unit 1
- 1810 Highland Ave Unit 22
- Parcel 2 Highcrest Rd
- 50 Clark St Unit 19
- 120 Terri Marie Way Unit 5-13
- 409 Crescent St
- 203 Martha St
- 1146 Ray St
- 29 Valentine St
- 120 Lewin St Unit 30
- 274 Archer St
- 280 Joseph Dr
- 2396 Riverside Ave
- 195 Crescent St Unit 2
- 3682 N Main St Unit 7
- 439 Archer St