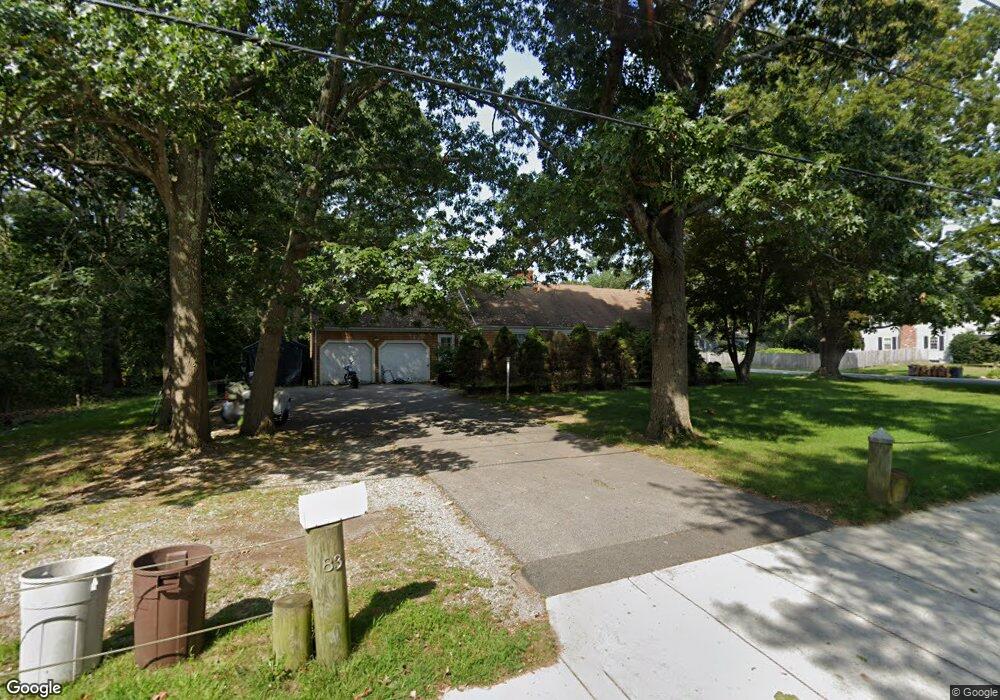
83 Middle Hwy Barrington, RI 02806
North Barrington NeighborhoodEstimated Value: $583,000 - $655,000
3
Beds
1
Bath
2,266
Sq Ft
$274/Sq Ft
Est. Value
About This Home
This home is located at 83 Middle Hwy, Barrington, RI 02806 and is currently estimated at $620,208, approximately $273 per square foot. 83 Middle Hwy is a home located in Bristol County with nearby schools including Barrington High School, St Luke Elementary School, and Barrington Christian Academy.
Ownership History
Date
Name
Owned For
Owner Type
Purchase Details
Closed on
Dec 9, 2002
Sold by
Davidson Dean and Davidson Diane
Bought by
Almeida-Kochler Marie and Almeida Marie
Current Estimated Value
Purchase Details
Closed on
May 1, 2002
Sold by
Mceldowney Gail W
Bought by
Davidson Dean S and Davidson Diane
Purchase Details
Closed on
Jan 29, 1993
Sold by
Kingsford Harle G and Kingsford Muriel
Bought by
Davidson Dean S and Davidson Diane
Create a Home Valuation Report for This Property
The Home Valuation Report is an in-depth analysis detailing your home's value as well as a comparison with similar homes in the area
Home Values in the Area
Average Home Value in this Area
Purchase History
| Date | Buyer | Sale Price | Title Company |
|---|---|---|---|
| Almeida-Kochler Marie | $285,000 | -- | |
| Davidson Dean S | $187,000 | -- | |
| Davidson Dean S | $138,000 | -- | |
| Davidson Dean S | $138,000 | -- |
Source: Public Records
Mortgage History
| Date | Status | Borrower | Loan Amount |
|---|---|---|---|
| Open | Davidson Dean S | $343,159 | |
| Closed | Davidson Dean S | $388,000 | |
| Closed | Davidson Dean S | $50,000 |
Source: Public Records
Tax History Compared to Growth
Tax History
| Year | Tax Paid | Tax Assessment Tax Assessment Total Assessment is a certain percentage of the fair market value that is determined by local assessors to be the total taxable value of land and additions on the property. | Land | Improvement |
|---|---|---|---|---|
| 2025 | $7,133 | $465,000 | $247,000 | $218,000 |
| 2024 | $6,859 | $465,000 | $247,000 | $218,000 |
| 2023 | $6,395 | $315,000 | $147,000 | $168,000 |
| 2022 | $6,190 | $315,000 | $147,000 | $168,000 |
| 2021 | $6,032 | $315,000 | $147,000 | $168,000 |
| 2020 | $5,852 | $280,000 | $128,000 | $152,000 |
| 2019 | $5,628 | $280,000 | $128,000 | $152,000 |
| 2018 | $5,460 | $280,000 | $128,000 | $152,000 |
| 2017 | $5,330 | $266,500 | $126,400 | $140,100 |
| 2016 | $4,917 | $266,500 | $126,400 | $140,100 |
| 2015 | $4,864 | $266,500 | $126,400 | $140,100 |
| 2014 | $5,097 | $278,500 | $126,600 | $151,900 |
Source: Public Records
Map
Nearby Homes