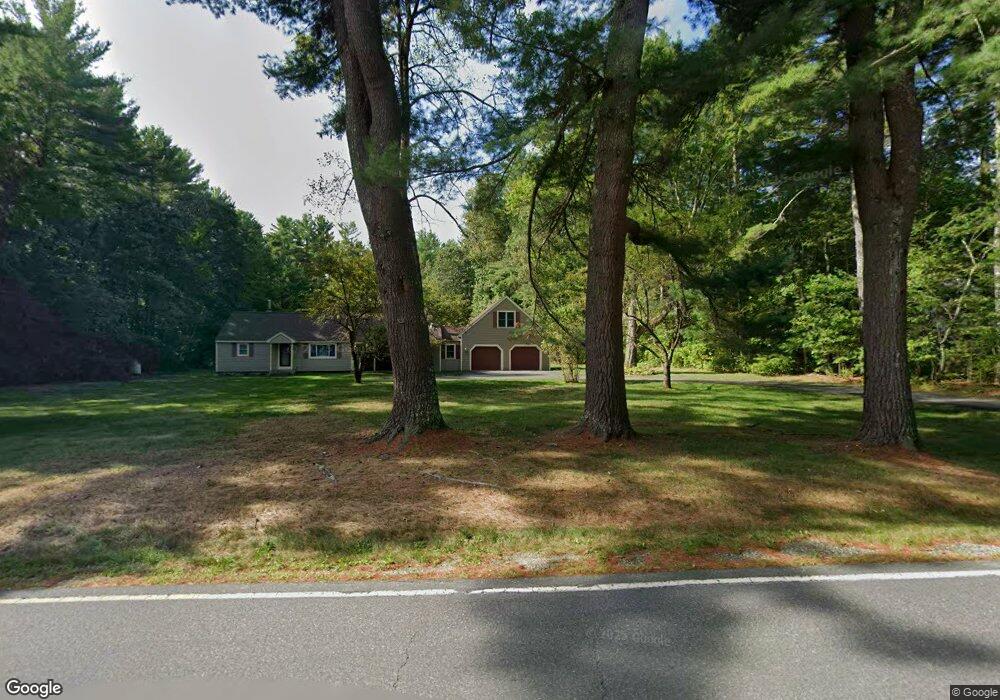
83 Pepperell Rd Hollis, NH 03049
Hollis NeighborhoodEstimated Value: $542,749 - $779,000
3
Beds
2
Baths
961
Sq Ft
$656/Sq Ft
Est. Value
About This Home
This home is located at 83 Pepperell Rd, Hollis, NH 03049 and is currently estimated at $629,937, approximately $655 per square foot. 83 Pepperell Rd is a home with nearby schools including Hollis Primary School, Hollis Upper Elementary School, and Hollis-Brookline Middle School.
Ownership History
Date
Name
Owned For
Owner Type
Purchase Details
Closed on
Apr 15, 2014
Sold by
Archambault Mark
Bought by
Archambault Ft
Current Estimated Value
Purchase Details
Closed on
Mar 17, 1999
Sold by
Baker Kathryn A
Bought by
Archambault Mark
Home Financials for this Owner
Home Financials are based on the most recent Mortgage that was taken out on this home.
Original Mortgage
$104,000
Interest Rate
6.74%
Create a Home Valuation Report for This Property
The Home Valuation Report is an in-depth analysis detailing your home's value as well as a comparison with similar homes in the area
Home Values in the Area
Average Home Value in this Area
Purchase History
| Date | Buyer | Sale Price | Title Company |
|---|---|---|---|
| Archambault Ft | -- | -- | |
| Archambault Mark | $130,000 | -- |
Source: Public Records
Mortgage History
| Date | Status | Borrower | Loan Amount |
|---|---|---|---|
| Previous Owner | Archambault Mark | $200,000 | |
| Previous Owner | Archambault Mark | $104,000 |
Source: Public Records
Tax History Compared to Growth
Tax History
| Year | Tax Paid | Tax Assessment Tax Assessment Total Assessment is a certain percentage of the fair market value that is determined by local assessors to be the total taxable value of land and additions on the property. | Land | Improvement |
|---|---|---|---|---|
| 2024 | $8,457 | $477,000 | $265,900 | $211,100 |
| 2023 | $7,947 | $477,000 | $265,900 | $211,100 |
| 2022 | $10,766 | $477,000 | $265,900 | $211,100 |
| 2021 | $6,504 | $286,500 | $170,100 | $116,400 |
| 2020 | $6,641 | $286,500 | $170,100 | $116,400 |
| 2019 | $3,002 | $286,500 | $170,100 | $116,400 |
| 2018 | $6,208 | $286,500 | $170,100 | $116,400 |
| 2017 | $5,959 | $257,400 | $145,500 | $111,900 |
| 2016 | $6,031 | $257,400 | $145,500 | $111,900 |
| 2015 | $5,925 | $257,400 | $145,500 | $111,900 |
| 2014 | $5,954 | $257,400 | $145,500 | $111,900 |
| 2013 | $5,874 | $257,400 | $145,500 | $111,900 |
Source: Public Records
Map
Nearby Homes
- 77 Pepperell Rd
- 5 Spaulding Ln Unit A
- 5 Spaulding Ln
- 5-A B Spaulding Ln
- 89 Pepperell Rd
- 4 Spaulding Ln
- 15 Spaulding Ln
- 73 Pepperell Rd
- 69 Pepperell Rd
- 66 Pepperell Rd
- 16 Spaulding Ln
- 7 Baldwin Ln
- 33 Spaulding Ln
- 22 Black Oak Dr
- 11 Baldwin Ln
- 8 Baldwin Ln
- 26 Black Oak Dr
- 42 N Pepperell Rd
- 108 Pepperell Rd
- 46 Pepperell Rd