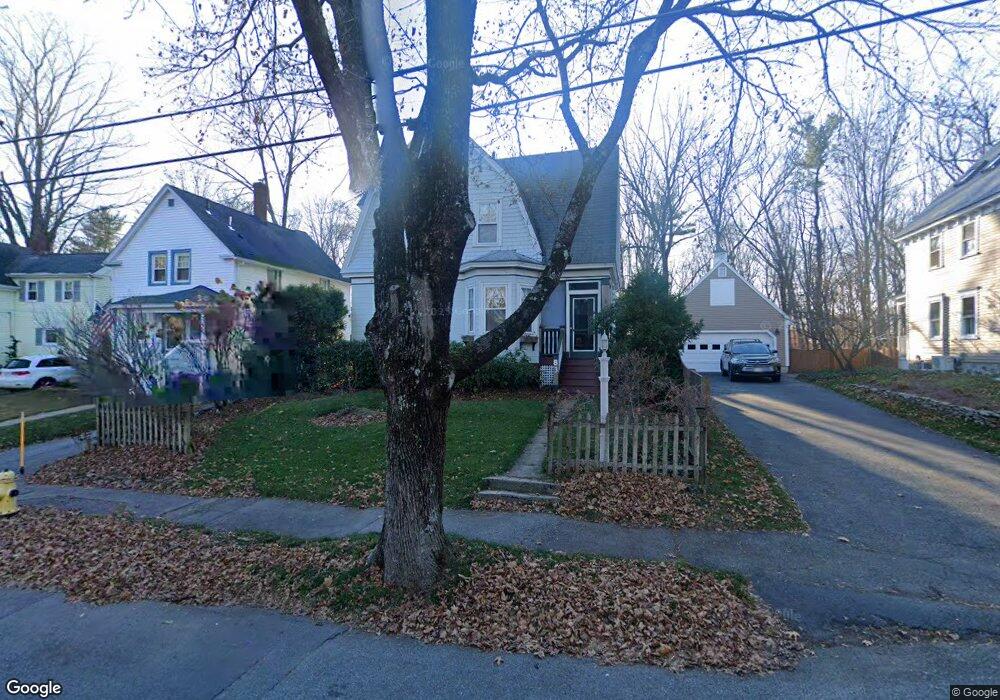
83 Pine St Andover, MA 01810
East Andover NeighborhoodEstimated Value: $770,955 - $1,078,000
3
Beds
2
Baths
1,600
Sq Ft
$539/Sq Ft
Est. Value
About This Home
This home is located at 83 Pine St, Andover, MA 01810 and is currently estimated at $861,989, approximately $538 per square foot. 83 Pine St is a home located in Essex County with nearby schools including Bancroft Elementary School, Doherty Middle School, and Andover High School.
Ownership History
Date
Name
Owned For
Owner Type
Purchase Details
Closed on
May 6, 2016
Sold by
Braude Eric J and Braude Judith S
Bought by
Braude Ft and Braude
Current Estimated Value
Purchase Details
Closed on
Mar 15, 2002
Sold by
Belford Constr Inc
Bought by
Braude Eric J and Braude Judith Sherry
Purchase Details
Closed on
May 29, 2001
Sold by
Mcgrath John M and Mcgrath Jean A
Bought by
Belford Construction
Create a Home Valuation Report for This Property
The Home Valuation Report is an in-depth analysis detailing your home's value as well as a comparison with similar homes in the area
Home Values in the Area
Average Home Value in this Area
Purchase History
| Date | Buyer | Sale Price | Title Company |
|---|---|---|---|
| Braude Ft | -- | -- | |
| Braude Ft | -- | -- | |
| Braude Eric J | $360,000 | -- | |
| Braude Eric J | $360,000 | -- | |
| Belford Construction | $280,000 | -- | |
| Belford Construction | $280,000 | -- |
Source: Public Records
Mortgage History
| Date | Status | Borrower | Loan Amount |
|---|---|---|---|
| Previous Owner | Belford Construction | $200,000 |
Source: Public Records
Tax History
| Year | Tax Paid | Tax Assessment Tax Assessment Total Assessment is a certain percentage of the fair market value that is determined by local assessors to be the total taxable value of land and additions on the property. | Land | Improvement |
|---|---|---|---|---|
| 2024 | $9,178 | $712,600 | $428,600 | $284,000 |
| 2023 | $8,753 | $640,800 | $386,100 | $254,700 |
| 2022 | $8,377 | $573,800 | $341,700 | $232,100 |
| 2021 | $7,987 | $522,400 | $310,700 | $211,700 |
| 2020 | $7,655 | $510,000 | $303,100 | $206,900 |
| 2019 | $7,174 | $469,800 | $268,400 | $201,400 |
| 2018 | $6,849 | $437,900 | $253,200 | $184,700 |
| 2017 | $6,549 | $431,400 | $248,400 | $183,000 |
| 2016 | $6,155 | $415,300 | $232,300 | $183,000 |
| 2015 | $5,922 | $395,600 | $223,400 | $172,200 |
Source: Public Records
Map
Nearby Homes
- 1 Stratford Rd
- 81 Chestnut St Unit 81
- 46 Whittier St
- 62 Carmel Rd
- 33 Chestnut St Unit 2
- 36 High St
- 96 N Main St Unit 3
- 1 Sweeney Ct
- 100.5 Main St Unit Q
- 2 Powder Mill Square Unit 2B
- 154 Main St
- 181 High St Unit 1
- 70 Washington Park Dr Unit 6
- 40C Washington Park Dr Unit 12
- 1 Longwood Dr Unit 5 (109)
- 3 Longwood Dr Unit 107
- 11 Cuba St
- 170 Haverhill St Unit 138
- 17 Carisbrooke St
- 52 Salem St
Your Personal Tour Guide
Ask me questions while you tour the home.