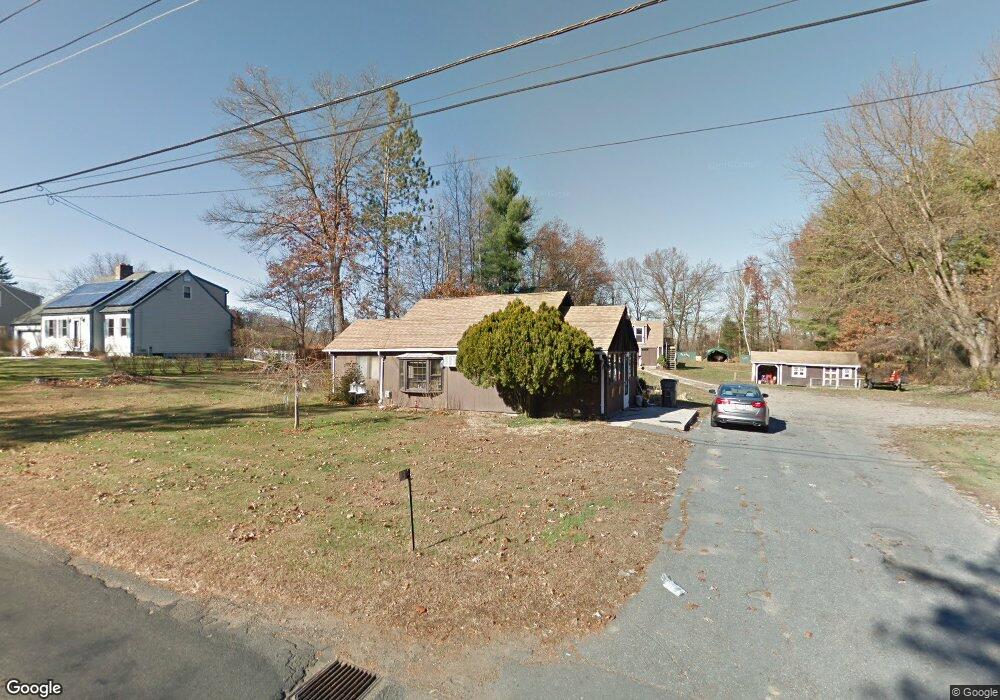
83 Plain St Easthampton, MA 01027
Estimated Value: $390,906 - $444,000
3
Beds
2
Baths
1,381
Sq Ft
$308/Sq Ft
Est. Value
About This Home
This home is located at 83 Plain St, Easthampton, MA 01027 and is currently estimated at $424,977, approximately $307 per square foot. 83 Plain St is a home located in Hampshire County with nearby schools including Easthampton High School, Calvary Baptist Christian School, and Tri-County Schools.
Ownership History
Date
Name
Owned For
Owner Type
Purchase Details
Closed on
Oct 22, 2007
Sold by
Larochelle Beverly S
Bought by
Larochelle Beverly S and Larochelle Tim J
Current Estimated Value
Create a Home Valuation Report for This Property
The Home Valuation Report is an in-depth analysis detailing your home's value as well as a comparison with similar homes in the area
Home Values in the Area
Average Home Value in this Area
Purchase History
| Date | Buyer | Sale Price | Title Company |
|---|---|---|---|
| Larochelle Beverly S | -- | -- |
Source: Public Records
Tax History
| Year | Tax Paid | Tax Assessment Tax Assessment Total Assessment is a certain percentage of the fair market value that is determined by local assessors to be the total taxable value of land and additions on the property. | Land | Improvement |
|---|---|---|---|---|
| 2025 | $4,425 | $323,700 | $124,400 | $199,300 |
| 2024 | $4,387 | $323,500 | $120,800 | $202,700 |
| 2023 | $3,387 | $231,200 | $95,900 | $135,300 |
| 2022 | $3,822 | $231,200 | $95,900 | $135,300 |
| 2021 | $4,169 | $237,700 | $95,900 | $141,800 |
| 2020 | $4,106 | $231,200 | $95,900 | $135,300 |
| 2019 | $3,455 | $223,500 | $95,900 | $127,600 |
| 2018 | $3,323 | $207,700 | $90,500 | $117,200 |
| 2017 | $3,245 | $200,200 | $86,900 | $113,300 |
| 2016 | $3,236 | $207,600 | $86,900 | $120,700 |
| 2015 | $3,145 | $207,600 | $86,900 | $120,700 |
Source: Public Records
Map
Nearby Homes
- 4 Laurel Dr
- 245 Park St
- 1 Plain St
- 2 W Park Dr
- 36 Line St
- 95 Gunn Rd
- 6 S St & Abutting Lots
- 41 South St Unit 11
- 7 Western View Rd
- 48 Gunn Rd
- 19 Mount Tom Ave Unit 19
- 385 Main St
- 38 College Hwy
- 19 Nicols Way Unit 19
- M143 &152 Glendale St
- 33 Knipfer Ave
- 36 County Rd
- 12 Golden Cir
- 10 Golden Cir
- 1205 Northampton St