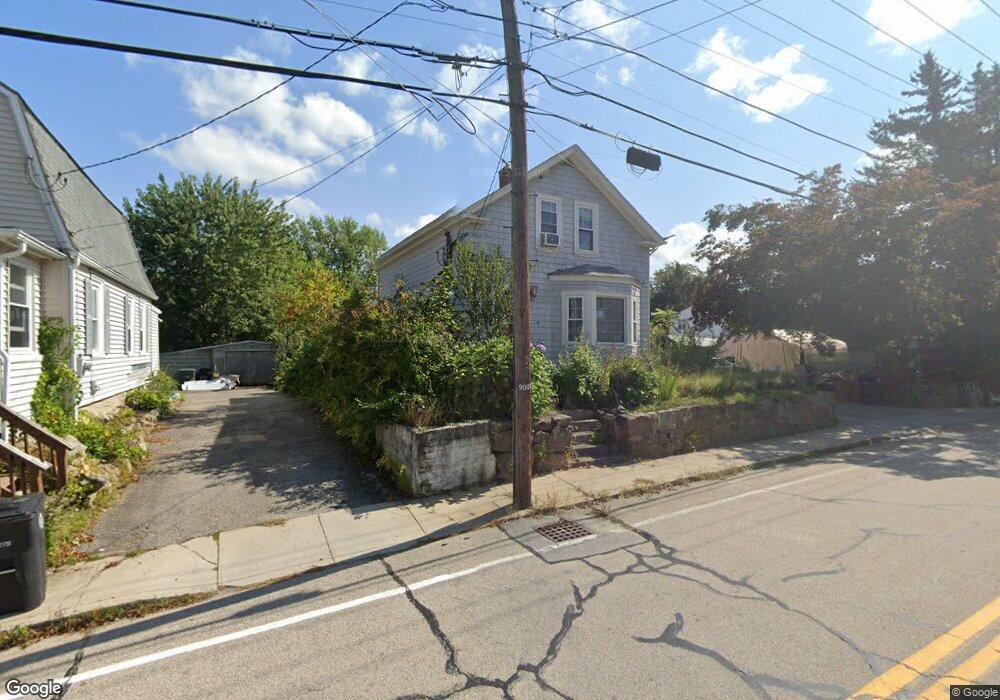
83 Read Ave Coventry, RI 02816
West Warwick Centre NeighborhoodEstimated Value: $339,000 - $367,000
2
Beds
2
Baths
1,252
Sq Ft
$280/Sq Ft
Est. Value
About This Home
This home is located at 83 Read Ave, Coventry, RI 02816 and is currently estimated at $350,716, approximately $280 per square foot. 83 Read Ave is a home located in Kent County with nearby schools including Alan Shawn Feinstein Ms Of Cov and Coventry High School.
Ownership History
Date
Name
Owned For
Owner Type
Purchase Details
Closed on
Sep 23, 2016
Sold by
Title Investment Co
Bought by
Rhodes Ronald L
Current Estimated Value
Purchase Details
Closed on
Mar 20, 2013
Sold by
Rhodes Donald L
Bought by
Rhodes Donald L and Rhodes Carla D
Home Financials for this Owner
Home Financials are based on the most recent Mortgage that was taken out on this home.
Original Mortgage
$140,000
Interest Rate
3.57%
Purchase Details
Closed on
Sep 8, 2003
Sold by
Michael Chad Everett
Bought by
Rhodes Donald L and Chappell Tracy Ann
Purchase Details
Closed on
Jul 30, 2001
Sold by
Soder Carolann
Bought by
Michael Chad E
Create a Home Valuation Report for This Property
The Home Valuation Report is an in-depth analysis detailing your home's value as well as a comparison with similar homes in the area
Home Values in the Area
Average Home Value in this Area
Purchase History
| Date | Buyer | Sale Price | Title Company |
|---|---|---|---|
| Rhodes Ronald L | $2,222 | -- | |
| Rhodes Donald L | -- | -- | |
| Rhodes Donald L | $163,000 | -- | |
| Michael Chad E | $104,000 | -- |
Source: Public Records
Mortgage History
| Date | Status | Borrower | Loan Amount |
|---|---|---|---|
| Previous Owner | Michael Chad E | $140,000 | |
| Previous Owner | Michael Chad E | $25,000 | |
| Previous Owner | Michael Chad E | $165,000 |
Source: Public Records
Tax History
| Year | Tax Paid | Tax Assessment Tax Assessment Total Assessment is a certain percentage of the fair market value that is determined by local assessors to be the total taxable value of land and additions on the property. | Land | Improvement |
|---|---|---|---|---|
| 2025 | $4,386 | $272,600 | $96,800 | $175,800 |
| 2024 | $3,876 | $244,700 | $96,800 | $147,900 |
| 2023 | $3,751 | $244,700 | $96,800 | $147,900 |
| 2022 | $3,703 | $189,200 | $92,600 | $96,600 |
| 2021 | $3,670 | $189,200 | $92,600 | $96,600 |
| 2020 | $4,208 | $189,200 | $92,600 | $96,600 |
| 2019 | $3,747 | $168,500 | $77,900 | $90,600 |
| 2018 | $3,641 | $168,500 | $77,900 | $90,600 |
| 2017 | $3,535 | $168,500 | $77,900 | $90,600 |
| 2016 | $3,220 | $150,400 | $73,600 | $76,800 |
| 2015 | $3,133 | $150,400 | $73,600 | $76,800 |
| 2014 | $3,067 | $150,400 | $73,600 | $76,800 |
| 2013 | $3,071 | $164,600 | $82,100 | $82,500 |
Source: Public Records
Map
Nearby Homes
Your Personal Tour Guide
Ask me questions while you tour the home.