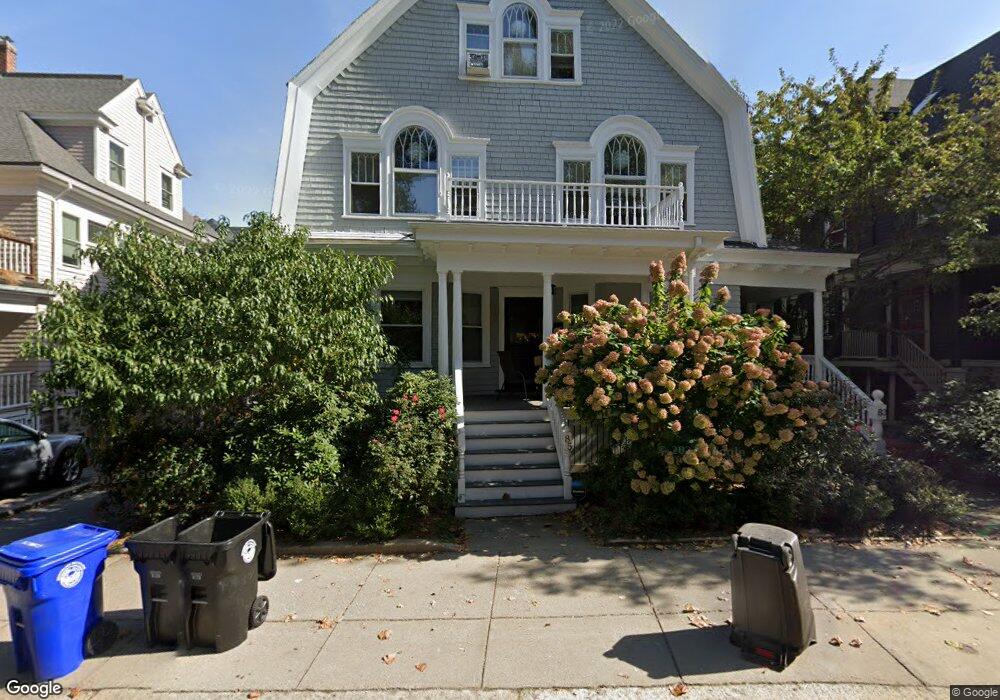
83 Saint Paul St Unit 2 Brookline, MA 02446
Coolidge Corner NeighborhoodEstimated Value: $1,595,000 - $1,970,000
3
Beds
3
Baths
2,321
Sq Ft
$756/Sq Ft
Est. Value
About This Home
This home is located at 83 Saint Paul St Unit 2, Brookline, MA 02446 and is currently estimated at $1,755,773, approximately $756 per square foot. 83 Saint Paul St Unit 2 is a home located in Norfolk County with nearby schools including Amos A. Lawrence School, St. Mary of the Assumption Elementary School, and Winsor School.
Ownership History
Date
Name
Owned For
Owner Type
Purchase Details
Closed on
Mar 27, 2013
Sold by
Carr John G and Zimon Alison E
Bought by
Zimon Alison E
Current Estimated Value
Home Financials for this Owner
Home Financials are based on the most recent Mortgage that was taken out on this home.
Original Mortgage
$465,000
Outstanding Balance
$327,306
Interest Rate
3.56%
Mortgage Type
New Conventional
Estimated Equity
$1,428,467
Purchase Details
Closed on
Oct 3, 2006
Sold by
Moskowitz Herbert and Moskowitz Ivan
Bought by
Zimon Alison E and Carr John G
Home Financials for this Owner
Home Financials are based on the most recent Mortgage that was taken out on this home.
Original Mortgage
$561,600
Interest Rate
6.52%
Mortgage Type
Purchase Money Mortgage
Create a Home Valuation Report for This Property
The Home Valuation Report is an in-depth analysis detailing your home's value as well as a comparison with similar homes in the area
Home Values in the Area
Average Home Value in this Area
Purchase History
| Date | Buyer | Sale Price | Title Company |
|---|---|---|---|
| Zimon Alison E | -- | -- | |
| Zimon Alison E | $702,000 | -- |
Source: Public Records
Mortgage History
| Date | Status | Borrower | Loan Amount |
|---|---|---|---|
| Open | Zimon Alison E | $465,000 | |
| Closed | Zimon Alison E | $150,000 | |
| Previous Owner | Zimon Alison E | $561,600 | |
| Previous Owner | Zimon Alison E | $104,850 |
Source: Public Records
Tax History Compared to Growth
Tax History
| Year | Tax Paid | Tax Assessment Tax Assessment Total Assessment is a certain percentage of the fair market value that is determined by local assessors to be the total taxable value of land and additions on the property. | Land | Improvement |
|---|---|---|---|---|
| 2025 | $14,978 | $1,517,500 | $0 | $1,517,500 |
| 2024 | $14,536 | $1,487,800 | $0 | $1,487,800 |
| 2023 | $14,150 | $1,419,300 | $0 | $1,419,300 |
| 2022 | $14,042 | $1,378,000 | $0 | $1,378,000 |
| 2021 | $13,371 | $1,364,400 | $0 | $1,364,400 |
| 2020 | $12,766 | $1,350,900 | $0 | $1,350,900 |
| 2019 | $12,055 | $1,286,600 | $0 | $1,286,600 |
| 2018 | $11,591 | $1,225,300 | $0 | $1,225,300 |
| 2017 | $11,209 | $1,134,500 | $0 | $1,134,500 |
| 2016 | $10,747 | $1,031,400 | $0 | $1,031,400 |
| 2015 | $10,014 | $937,600 | $0 | $937,600 |
| 2014 | $9,986 | $876,700 | $0 | $876,700 |
Source: Public Records
Map
Nearby Homes
- 30 Stearns Rd Unit 302
- 65 Francis St Unit 65
- 65 Francis St
- 45 Longwood Ave Unit 812
- 45 Longwood Ave Unit PHA
- 60 Longwood Ave Unit 802
- 60 Longwood Ave Unit 307
- 60 Longwood Ave Unit 403
- 50 Longwood Ave Unit 611
- 151 Longwood Ave Unit 1
- 106 Brook St
- 120 Brook St Unit 1
- 15 James St Unit 2
- 17 James St Unit 1
- 5 Auburn Ct Unit 1
- 216 Aspinwall Ave
- 214 Aspinwall Ave Unit 2
- 24 Auburn St Unit 1
- 24 Auburn St Unit 2
- 24 Auburn St Unit 3
- 83 Saint Paul St Unit 85
- 83 Saint Paul St Unit 85
- 83 Saint Paul St Unit 84 1
- 83 Saint Paul St Unit 83 1
- 83 Saint Paul St Unit 83
- 85 Saint Paul St Unit 1
- 85 Saint Paul St Unit 84-1
- 85 Saint Paul St Unit 82-6
- 85 Saint Paul St Unit 86-2
- 85 Saint Paul St Unit 85
- 79-81 St Paul St
- 79 Saint Paul St Unit 81
- 79 Saint Paul St Unit 81
- 79 Saint Paul St Unit 1
- 81 Saint Paul St Unit 86-2
- 81 Saint Paul St Unit 82-4
- 81 Saint Paul St Unit 82-2
- 81 Saint Paul St Unit 2
- 81 Saint Paul St Unit 4
- 81 Saint Paul St Unit 81