83 View St Meriden, CT 06450
Estimated Value: $213,000 - $380,219
3
Beds
2
Baths
3,160
Sq Ft
$104/Sq Ft
Est. Value
About This Home
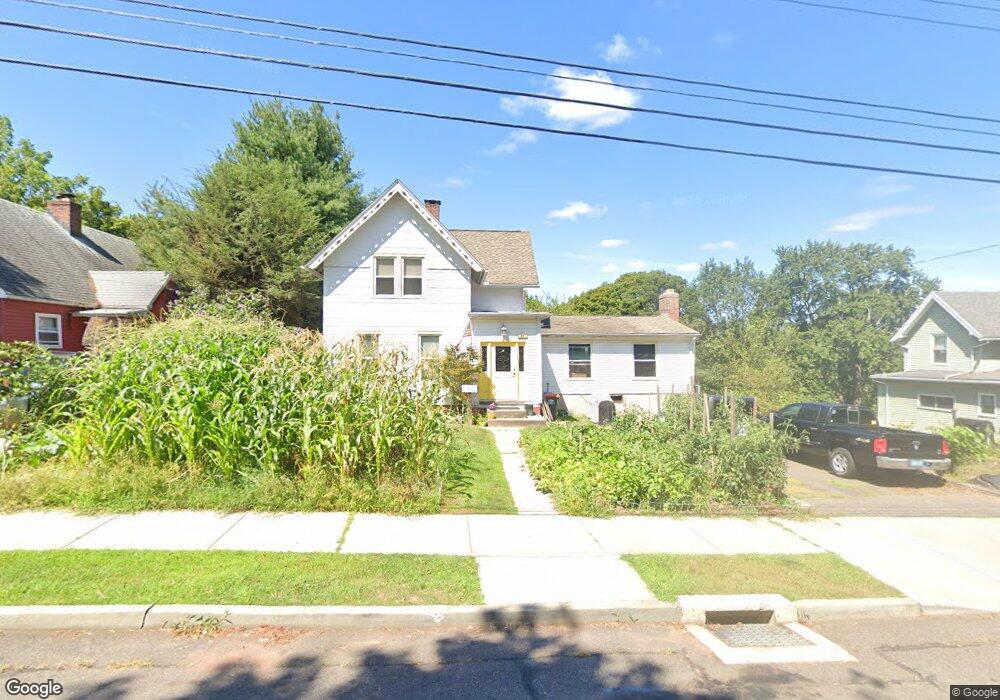
This home is located at 83 View St, Meriden, CT 06450 and is currently estimated at $327,555, approximately $103 per square foot. 83 View St is a home located in New Haven County with nearby schools including Casimir Pulaski School, Washington Middle School, and Francis T. Maloney High School.
Ownership History
Date
Name
Owned For
Owner Type
Purchase Details
Closed on
Jan 28, 1998
Sold by
Fhlmc
Bought by
Forster Jayson E
Current Estimated Value
Home Financials for this Owner
Home Financials are based on the most recent Mortgage that was taken out on this home.
Original Mortgage
$47,000
Interest Rate
7.02%
Mortgage Type
Unknown
Purchase Details
Closed on
Jun 3, 1988
Sold by
Letourneau Beryl E
Bought by
Pollock John F
Home Financials for this Owner
Home Financials are based on the most recent Mortgage that was taken out on this home.
Original Mortgage
$130,000
Interest Rate
10.24%
Create a Home Valuation Report for This Property
The Home Valuation Report is an in-depth analysis detailing your home's value as well as a comparison with similar homes in the area
Home Values in the Area
Average Home Value in this Area
Purchase History
| Date | Buyer | Sale Price | Title Company |
|---|---|---|---|
| Forster Jayson E | $57,000 | -- | |
| Pollock John F | $145,000 | -- |
Source: Public Records
Mortgage History
| Date | Status | Borrower | Loan Amount |
|---|---|---|---|
| Closed | Pollock John F | $47,000 | |
| Previous Owner | Pollock John F | $130,000 |
Source: Public Records
Tax History
| Year | Tax Paid | Tax Assessment Tax Assessment Total Assessment is a certain percentage of the fair market value that is determined by local assessors to be the total taxable value of land and additions on the property. | Land | Improvement |
|---|---|---|---|---|
| 2025 | $5,822 | $153,580 | $39,620 | $113,960 |
| 2024 | $5,914 | $153,580 | $39,620 | $113,960 |
| 2023 | $5,701 | $153,580 | $39,620 | $113,960 |
| 2022 | $5,378 | $153,580 | $39,620 | $113,960 |
| 2021 | $4,299 | $98,770 | $45,010 | $53,760 |
| 2020 | $4,288 | $98,770 | $45,010 | $53,760 |
| 2019 | $4,251 | $98,770 | $45,010 | $53,760 |
| 2018 | $4,268 | $98,770 | $45,010 | $53,760 |
| 2017 | $4,154 | $98,770 | $45,010 | $53,760 |
| 2016 | $4,055 | $104,580 | $35,070 | $69,510 |
| 2015 | $4,055 | $104,580 | $35,070 | $69,510 |
| 2014 | $3,956 | $104,580 | $35,070 | $69,510 |
Source: Public Records
Map
Nearby Homes
- 144 View St
- 151 View St
- 178 Elm St
- 122 Willow St
- 121 Willow St
- 80 Willow St
- 223 Broad St
- 31 Winthrop St
- 104 Gale Ave
- 74 Randolph Ave
- 25 Catlin St
- 33 W Main St Unit 11
- 33 W Main St Unit 16
- 33 W Main St Unit 1
- 61 Randolph Ave
- 86 Linsley Ave
- 121 Liberty St
- 185 Carter Avenue Extension
- 206 Gale Ave
- 203 Spring St
Your Personal Tour Guide
Ask me questions while you tour the home.