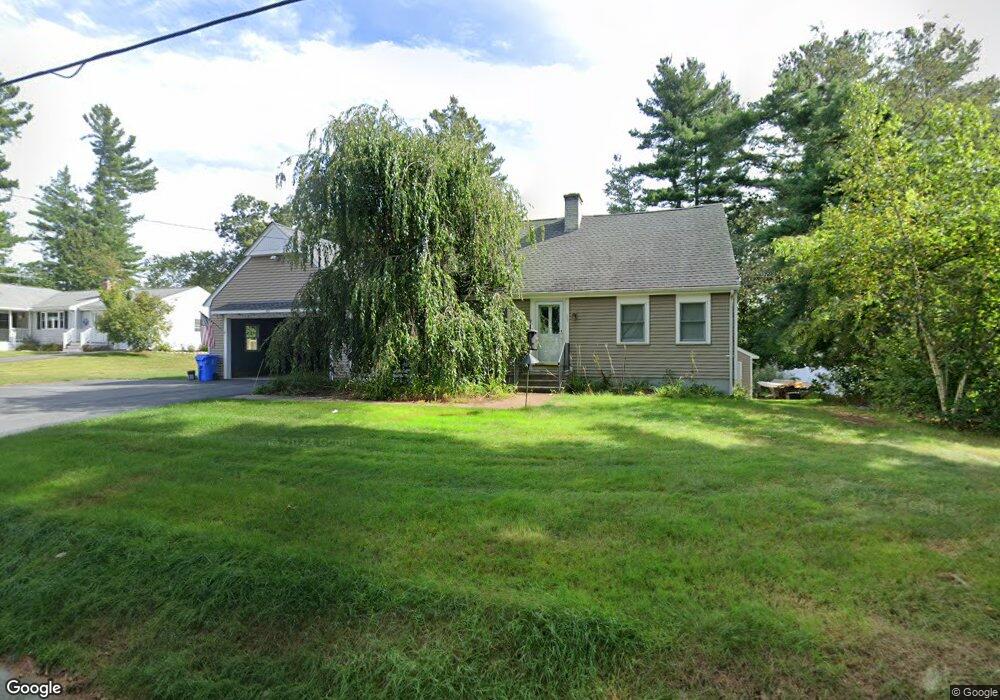
83 Wilkins Rd Holliston, MA 01746
Estimated Value: $628,000 - $663,000
3
Beds
2
Baths
1,326
Sq Ft
$485/Sq Ft
Est. Value
About This Home
This home is located at 83 Wilkins Rd, Holliston, MA 01746 and is currently estimated at $642,489, approximately $484 per square foot. 83 Wilkins Rd is a home located in Middlesex County with nearby schools including Placentino Elementary School, Miller Elementary School, and Robert H. Adams Middle School.
Ownership History
Date
Name
Owned For
Owner Type
Purchase Details
Closed on
Feb 12, 2026
Sold by
Dunham Lt and Dunham
Bought by
Bakas Bryan and Dupont Bailey
Current Estimated Value
Home Financials for this Owner
Home Financials are based on the most recent Mortgage that was taken out on this home.
Original Mortgage
$496,000
Outstanding Balance
$496,000
Interest Rate
6.15%
Mortgage Type
New Conventional
Estimated Equity
$146,489
Purchase Details
Closed on
Oct 14, 2022
Sold by
Dunham David
Bought by
Dunham Lt and Dunham
Purchase Details
Closed on
Jun 8, 2006
Sold by
83 Wilkins Road Rt and Nolan
Bought by
Dunham David
Home Financials for this Owner
Home Financials are based on the most recent Mortgage that was taken out on this home.
Original Mortgage
$268,000
Interest Rate
6.62%
Mortgage Type
Purchase Money Mortgage
Purchase Details
Closed on
Mar 22, 2003
Sold by
Nolan Mary E
Bought by
Tr 86 Wilkins Road and Tr Mary E Nolan
Create a Home Valuation Report for This Property
The Home Valuation Report is an in-depth analysis detailing your home's value as well as a comparison with similar homes in the area
Home Values in the Area
Average Home Value in this Area
Purchase History
| Date | Buyer | Sale Price | Title Company |
|---|---|---|---|
| Bakas Bryan | $620,000 | -- | |
| Dunham Lt | -- | None Available | |
| Dunham David | $335,000 | -- | |
| Tr 86 Wilkins Road | -- | -- |
Source: Public Records
Mortgage History
| Date | Status | Borrower | Loan Amount |
|---|---|---|---|
| Open | Bakas Bryan | $496,000 | |
| Previous Owner | Dunham David | $268,000 |
Source: Public Records
Tax History
| Year | Tax Paid | Tax Assessment Tax Assessment Total Assessment is a certain percentage of the fair market value that is determined by local assessors to be the total taxable value of land and additions on the property. | Land | Improvement |
|---|---|---|---|---|
| 2025 | $8,430 | $575,400 | $243,700 | $331,700 |
| 2024 | $7,551 | $501,400 | $243,700 | $257,700 |
| 2023 | $7,592 | $493,000 | $243,700 | $249,300 |
| 2022 | $7,753 | $446,100 | $243,700 | $202,400 |
| 2021 | $7,759 | $434,700 | $232,300 | $202,400 |
| 2020 | $7,304 | $387,500 | $209,700 | $177,800 |
| 2019 | $7,074 | $375,700 | $203,500 | $172,200 |
| 2018 | $7,014 | $375,700 | $203,500 | $172,200 |
| 2017 | $7,149 | $386,000 | $207,700 | $178,300 |
| 2016 | $5,408 | $287,800 | $178,400 | $109,400 |
| 2015 | $4,826 | $249,000 | $144,400 | $104,600 |
Source: Public Records
Map
Nearby Homes
- 22 Greenview Dr
- 26 Mechanic St
- 1366 Washington St
- 110 Union St
- 35 Peter St
- 20 Constitution Cir
- 892 Highland St
- 25 Irving Place
- 51 Burnap Rd Unit 3
- 31 Francine Dr
- 48 Hemlock Dr
- 157 Rolling Meadow Dr
- 44 Baker St
- 66 Lakeshore Dr
- 244 Rolling Meadow Dr
- 6 Skyview Terrace
- 53 Regal St
- 48 N Mill St
- 110 Bonney Dr
- 0 Hill St
Your Personal Tour Guide
Ask me questions while you tour the home.