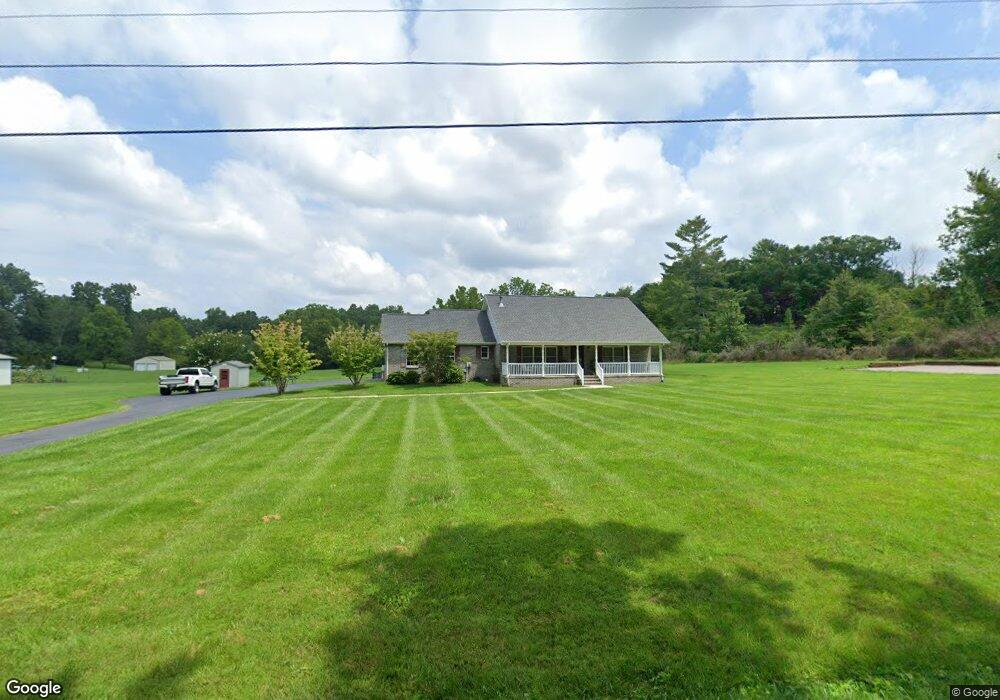
830 Frost Rd Crossville, TN 38571
Estimated Value: $328,000 - $372,000
--
Bed
2
Baths
1,504
Sq Ft
$239/Sq Ft
Est. Value
About This Home
This home is located at 830 Frost Rd, Crossville, TN 38571 and is currently estimated at $359,445, approximately $238 per square foot. 830 Frost Rd is a home located in Cumberland County with nearby schools including Pleasant Hill Elementary School, Cumberland County High School, and Christian Academy of the Cumberlands.
Ownership History
Date
Name
Owned For
Owner Type
Purchase Details
Closed on
Feb 2, 2024
Sold by
York Brenda and Paquette Peggy
Bought by
Woodson Gregory and Woodson Amanda
Current Estimated Value
Home Financials for this Owner
Home Financials are based on the most recent Mortgage that was taken out on this home.
Original Mortgage
$340,650
Outstanding Balance
$267,116
Interest Rate
6.61%
Mortgage Type
New Conventional
Estimated Equity
$92,329
Purchase Details
Closed on
Dec 23, 2008
Sold by
Painter Edgar
Bought by
Carr Brenda K
Purchase Details
Closed on
Aug 31, 2005
Sold by
Painter Edgar M
Bought by
Get Family Limited Partnership
Purchase Details
Closed on
Jun 14, 2002
Sold by
Painter Edgar and Painter Walcie
Bought by
Paquette Neil Allen
Purchase Details
Closed on
Jul 21, 1995
Sold by
Painter Nancy S
Bought by
Carr Kenneth A
Create a Home Valuation Report for This Property
The Home Valuation Report is an in-depth analysis detailing your home's value as well as a comparison with similar homes in the area
Home Values in the Area
Average Home Value in this Area
Purchase History
| Date | Buyer | Sale Price | Title Company |
|---|---|---|---|
| Woodson Gregory | $350,000 | Looney & Chadwell Title Servic | |
| Carr Brenda K | $5,000 | -- | |
| Get Family Limited Partnership | $530,600 | -- | |
| Paquette Neil Allen | $7,300 | -- | |
| Carr Kenneth A | $2,300 | -- |
Source: Public Records
Mortgage History
| Date | Status | Borrower | Loan Amount |
|---|---|---|---|
| Open | Woodson Gregory | $340,650 |
Source: Public Records
Tax History Compared to Growth
Tax History
| Year | Tax Paid | Tax Assessment Tax Assessment Total Assessment is a certain percentage of the fair market value that is determined by local assessors to be the total taxable value of land and additions on the property. | Land | Improvement |
|---|---|---|---|---|
| 2025 | $734 | $64,675 | $5,225 | $59,450 |
| 2024 | $734 | $64,675 | $5,225 | $59,450 |
| 2023 | $734 | $64,675 | $0 | $0 |
| 2022 | $734 | $64,675 | $5,225 | $59,450 |
| 2021 | $675 | $43,100 | $5,225 | $37,875 |
| 2020 | $675 | $43,100 | $5,225 | $37,875 |
| 2019 | $675 | $43,100 | $5,225 | $37,875 |
| 2018 | $675 | $43,100 | $5,225 | $37,875 |
| 2017 | $675 | $43,100 | $5,225 | $37,875 |
| 2016 | $607 | $39,750 | $5,225 | $34,525 |
| 2015 | $595 | $39,750 | $5,225 | $34,525 |
| 2014 | $595 | $39,754 | $0 | $0 |
Source: Public Records
Map
Nearby Homes
- 171 Red Oak Dr
- 275 Hawthorn Loop
- 2 Tennessee Ave
- 3 Tennessee Ave
- 122 Lee Cir
- 229 Hawthorn Loop
- 41 Hawthorn Cir
- 36 White Oak Cir
- 172 Hawthorn Loop
- 150 Dillon St
- 81 Juniper Ln
- 27 Hickory Hollow Cir
- 20 Juniper Ln
- 31 Juniper Ln
- 0 Holly Tree Dr Unit 1289825
- 533 Holly Tree Dr
- 0 Gardens Rv Dr
- 0 Juniper Ln
- 50 Gardens Rv Dr
- 88 acres Sparta Hwy