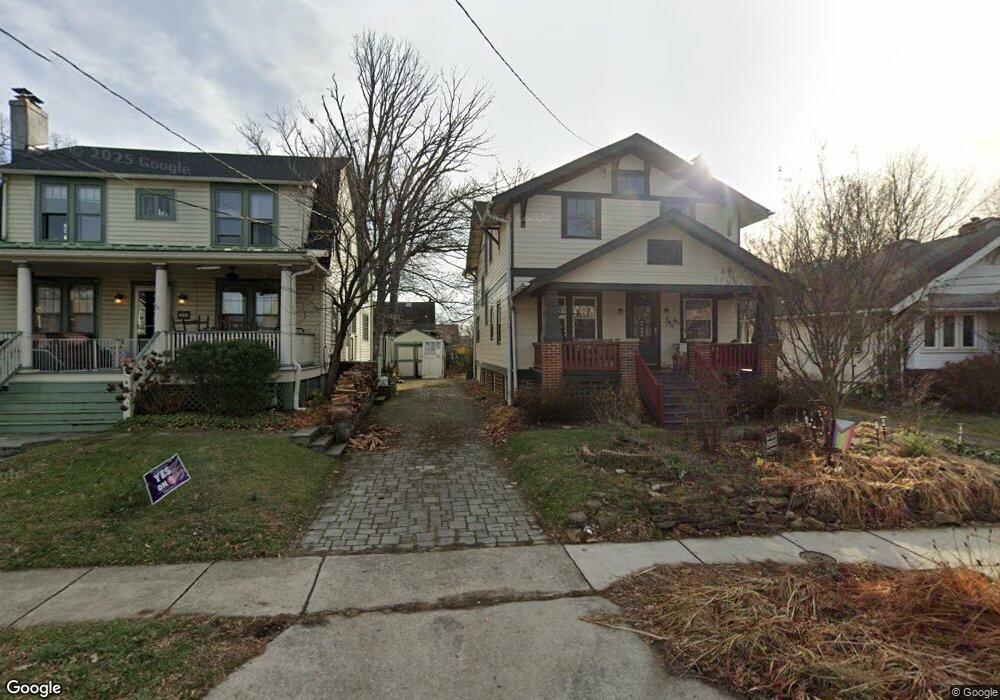
830 Gist Ave Silver Spring, MD 20910
Silver Spring Park NeighborhoodEstimated Value: $741,000 - $840,000
Studio
3
Baths
2,064
Sq Ft
$375/Sq Ft
Est. Value
About This Home
This home is located at 830 Gist Ave, Silver Spring, MD 20910 and is currently estimated at $773,936, approximately $374 per square foot. 830 Gist Ave is a home located in Montgomery County with nearby schools including Takoma Park Middle School, Montgomery Blair High School, and St. Michael the Archangel Catholic Church.
Ownership History
Date
Name
Owned For
Owner Type
Purchase Details
Closed on
Dec 18, 2008
Sold by
Wang Hans C
Bought by
Wang Mary C
Current Estimated Value
Purchase Details
Closed on
Dec 15, 2008
Sold by
Wang Hans C
Bought by
Wang Mary C
Purchase Details
Closed on
Mar 2, 2004
Sold by
Bowman Mary C Tr
Bought by
Wang Hans C and Wang Mary C
Purchase Details
Closed on
Jan 19, 1999
Sold by
Mary C Bowman
Bought by
Mary C Bowman Tr
Purchase Details
Closed on
May 1, 1997
Sold by
A Elizabeth D and A Thaden C
Bought by
Mary C Bowman
Create a Home Valuation Report for This Property
The Home Valuation Report is an in-depth analysis detailing your home's value as well as a comparison with similar homes in the area
Home Values in the Area
Average Home Value in this Area
Purchase History
| Date | Buyer | Sale Price | Title Company |
|---|---|---|---|
| Wang Mary C | -- | -- | |
| Wang Mary C | -- | -- | |
| Wang Hans C | -- | -- | |
| Wang Hans C | -- | -- | |
| Mary C Bowman Tr | -- | -- | |
| Mary C Bowman | $115,000 | -- |
Source: Public Records
Tax History
| Year | Tax Paid | Tax Assessment Tax Assessment Total Assessment is a certain percentage of the fair market value that is determined by local assessors to be the total taxable value of land and additions on the property. | Land | Improvement |
|---|---|---|---|---|
| 2025 | $7,855 | $634,867 | -- | -- |
| 2024 | $7,855 | $618,800 | $313,500 | $305,300 |
| 2023 | $7,141 | $618,800 | $313,500 | $305,300 |
| 2022 | $6,790 | $618,800 | $313,500 | $305,300 |
| 2021 | $6,569 | $660,500 | $313,500 | $347,000 |
| 2020 | $6,569 | $607,933 | $0 | $0 |
| 2019 | $5,927 | $555,367 | $0 | $0 |
| 2018 | $5,352 | $502,800 | $313,500 | $189,300 |
| 2017 | $5,360 | $495,567 | $0 | $0 |
| 2016 | -- | $488,333 | $0 | $0 |
| 2015 | $4,872 | $481,100 | $0 | $0 |
| 2014 | $4,872 | $480,100 | $0 | $0 |
Source: Public Records
Map
Nearby Homes
- 8012 Grove St
- 8210 Grove St
- 736 Easley St
- 1201 East Hwy W Unit 222
- 1201 E West Hwy Unit 1
- 1201 E West Hwy
- 1201 E West Hwy
- 1201 E West Hwy
- 1201 E West Hwy
- 620 Mississippi Ave
- 708 Hankin St
- 7915 Eastern Ave Unit 1208
- 7915 Eastern Ave Unit 1011
- 7923 Eastern Ave Unit 404
- 7923 Eastern Ave Unit 105
- 7923 Eastern Ave Unit 303
- 7923 Eastern Ave Unit 704
- 930 Wayne Ave Unit 405
- 8045 Newell St Unit 107
- 8045 Newell St Unit 121
Your Personal Tour Guide
Ask me questions while you tour the home.