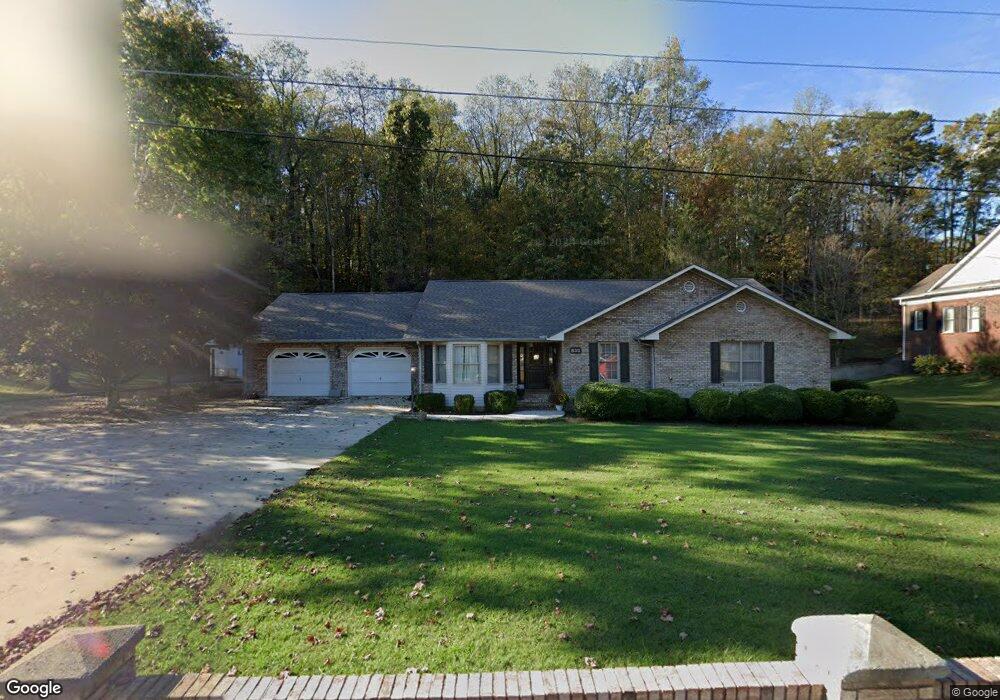
830 Holly Ave South Pittsburg, TN 37380
Estimated Value: $337,795 - $371,000
3
Beds
2
Baths
2,193
Sq Ft
$158/Sq Ft
Est. Value
About This Home
This home is located at 830 Holly Ave, South Pittsburg, TN 37380 and is currently estimated at $347,449, approximately $158 per square foot. 830 Holly Ave is a home located in Marion County with nearby schools including South Pittsburg Elementary School, Jasper Elementary School, and Monteagle Elementary School.
Ownership History
Date
Name
Owned For
Owner Type
Purchase Details
Closed on
May 31, 2024
Sold by
Phillips David A and Phillips Christy E
Bought by
Moss Cameron and Moss Jessica
Current Estimated Value
Home Financials for this Owner
Home Financials are based on the most recent Mortgage that was taken out on this home.
Original Mortgage
$283,882
Outstanding Balance
$280,314
Interest Rate
7.1%
Mortgage Type
FHA
Estimated Equity
$67,135
Purchase Details
Closed on
Aug 4, 2017
Sold by
Burrows Terry Lea and Rogers Terry Lea
Bought by
Phillips David A and Phillips Christy E
Home Financials for this Owner
Home Financials are based on the most recent Mortgage that was taken out on this home.
Original Mortgage
$233,700
Interest Rate
3.96%
Mortgage Type
New Conventional
Purchase Details
Closed on
Sep 6, 2007
Sold by
Terry Rogers James
Bought by
Lea Rogers Terry
Purchase Details
Closed on
Mar 5, 1992
Bought by
Rogers James Terry and Terry Lea
Purchase Details
Closed on
Feb 13, 1989
Bought by
Vinson Randall and Vinson Maria R
Create a Home Valuation Report for This Property
The Home Valuation Report is an in-depth analysis detailing your home's value as well as a comparison with similar homes in the area
Home Values in the Area
Average Home Value in this Area
Purchase History
| Date | Buyer | Sale Price | Title Company |
|---|---|---|---|
| Moss Cameron | $329,000 | None Listed On Document | |
| Phillips David A | $246,000 | None Available | |
| Lea Rogers Terry | -- | -- | |
| Rogers James Terry | $12,000 | -- | |
| Vinson Randall | -- | -- |
Source: Public Records
Mortgage History
| Date | Status | Borrower | Loan Amount |
|---|---|---|---|
| Open | Moss Cameron | $283,882 | |
| Previous Owner | Phillips David A | $233,700 |
Source: Public Records
Tax History Compared to Growth
Tax History
| Year | Tax Paid | Tax Assessment Tax Assessment Total Assessment is a certain percentage of the fair market value that is determined by local assessors to be the total taxable value of land and additions on the property. | Land | Improvement |
|---|---|---|---|---|
| 2024 | $932 | $63,050 | $9,150 | $53,900 |
| 2023 | $932 | $63,050 | $0 | $0 |
| 2022 | $1,576 | $63,050 | $9,150 | $53,900 |
| 2021 | $1,576 | $63,050 | $9,150 | $53,900 |
| 2020 | $1,575 | $63,050 | $9,150 | $53,900 |
| 2019 | $1,575 | $49,850 | $7,625 | $42,225 |
| 2018 | $1,575 | $49,850 | $7,625 | $42,225 |
| 2017 | $1,575 | $49,850 | $7,625 | $42,225 |
| 2016 | $1,575 | $49,850 | $0 | $0 |
| 2015 | $1,646 | $49,850 | $0 | $0 |
| 2014 | $1,646 | $52,097 | $0 | $0 |
Source: Public Records
Map
Nearby Homes
- 306 8th St
- 602 Elm Ave
- 207 6th St
- 602 Magnolia Ave
- 517 Laurel Ave
- 1105 Elm Ave
- 0 Laurel Ave Unit RTC2598433
- 0 Laurel Ave Unit 1365098
- 1209 Hickory Ave
- 1309 Holly Ave
- 0 Walnut Ave Unit RTC2928409
- 0 Walnut Ave Unit 1511452
- 210 Laurel Ave
- 306 Walnut Ave
- 304 Walnut Ave
- 711 2nd St
- 1007 3rd St
- 104 Locust Ave
- 1700 Marion Ave
- 1807 Hamilton Ave