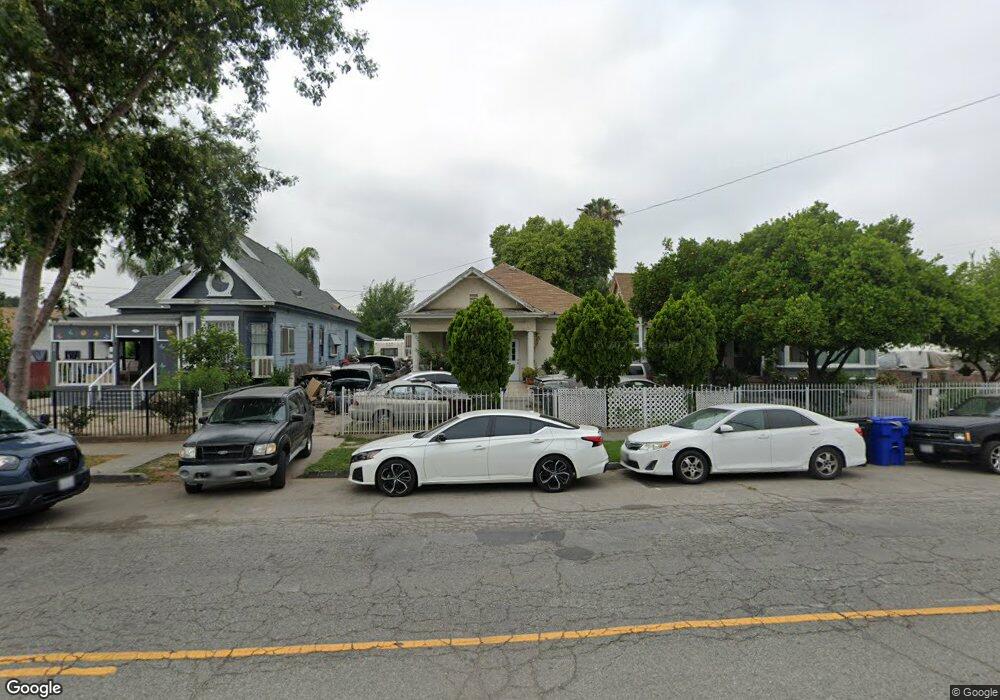
830 N G St San Bernardino, CA 92410
Civic Center NeighborhoodEstimated Value: $391,000 - $453,000
3
Beds
1
Bath
1,148
Sq Ft
$361/Sq Ft
Est. Value
About This Home
This home is located at 830 N G St, San Bernardino, CA 92410 and is currently estimated at $414,017, approximately $360 per square foot. 830 N G St is a home located in San Bernardino County with nearby schools including Juanita Blakely Jones Elementary School, Arrowview Middle School, and Indian Springs High.
Ownership History
Date
Name
Owned For
Owner Type
Purchase Details
Closed on
Jan 7, 2010
Sold by
Zepeda David
Bought by
Zepeda David and The Robert Mann Janis Mann Fra
Current Estimated Value
Purchase Details
Closed on
Dec 29, 2009
Sold by
Najar Eusebio
Bought by
Zepeda David and The Kenneth & Fran Gilbert & D
Purchase Details
Closed on
Mar 19, 2004
Sold by
Pankey Dana and Pankey Ruth E
Bought by
Najar Eusebio
Home Financials for this Owner
Home Financials are based on the most recent Mortgage that was taken out on this home.
Original Mortgage
$124,000
Interest Rate
5.45%
Mortgage Type
Purchase Money Mortgage
Purchase Details
Closed on
Dec 29, 1997
Sold by
Pankey Dana and Pankey Ruth E Tr
Bought by
Missions Today Trust
Create a Home Valuation Report for This Property
The Home Valuation Report is an in-depth analysis detailing your home's value as well as a comparison with similar homes in the area
Home Values in the Area
Average Home Value in this Area
Purchase History
| Date | Buyer | Sale Price | Title Company |
|---|---|---|---|
| Zepeda David | -- | None Available | |
| Zepeda David | -- | None Available | |
| Najar Eusebio | $155,000 | Orange Coast Title Company | |
| Missions Today Trust | -- | -- | |
| Pankey Dana | -- | -- |
Source: Public Records
Mortgage History
| Date | Status | Borrower | Loan Amount |
|---|---|---|---|
| Previous Owner | Najar Eusebio | $124,000 | |
| Closed | Najar Eusebio | $31,000 |
Source: Public Records
Tax History Compared to Growth
Tax History
| Year | Tax Paid | Tax Assessment Tax Assessment Total Assessment is a certain percentage of the fair market value that is determined by local assessors to be the total taxable value of land and additions on the property. | Land | Improvement |
|---|---|---|---|---|
| 2025 | $1,125 | $77,452 | $23,237 | $54,215 |
| 2024 | $1,125 | $75,933 | $22,781 | $53,152 |
| 2023 | $1,096 | $74,444 | $22,334 | $52,110 |
| 2022 | $1,094 | $72,984 | $21,896 | $51,088 |
| 2021 | $1,092 | $71,553 | $21,467 | $50,086 |
| 2020 | $1,091 | $70,819 | $21,247 | $49,572 |
| 2019 | $1,063 | $69,430 | $20,830 | $48,600 |
| 2018 | $1,052 | $68,069 | $20,422 | $47,647 |
| 2017 | $1,020 | $66,735 | $20,022 | $46,713 |
| 2016 | $990 | $65,426 | $19,629 | $45,797 |
| 2015 | $958 | $64,443 | $19,334 | $45,109 |
| 2014 | $833 | $63,180 | $18,955 | $44,225 |
Source: Public Records
Map
Nearby Homes