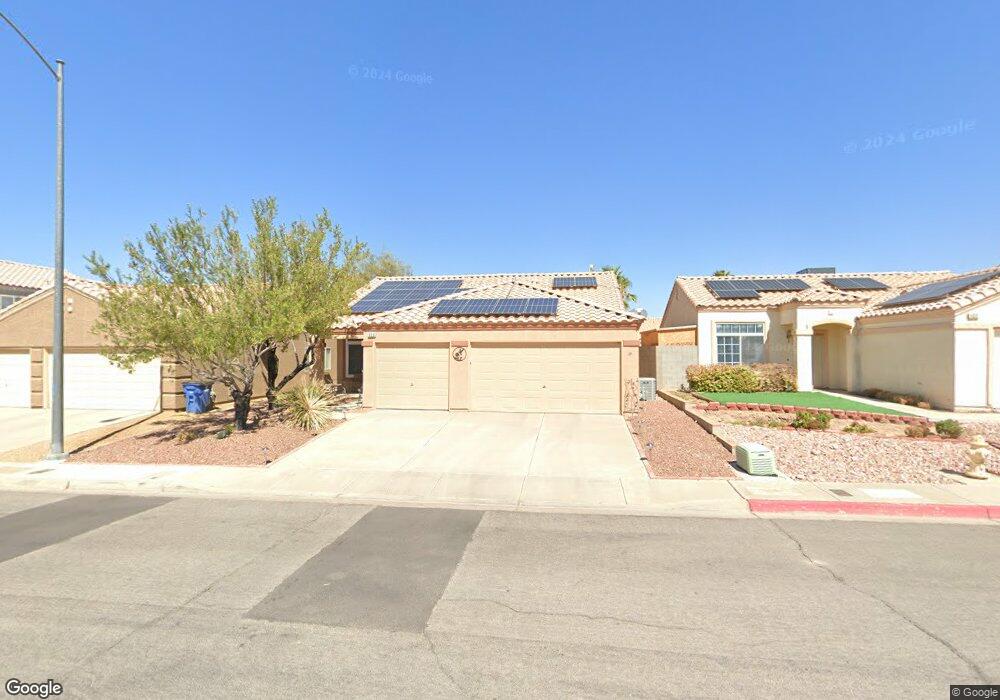
830 Zinnia Cir Henderson, NV 89015
Foothills NeighborhoodEstimated Value: $399,000 - $440,000
4
Beds
2
Baths
1,444
Sq Ft
$288/Sq Ft
Est. Value
About This Home
This home is located at 830 Zinnia Cir, Henderson, NV 89015 and is currently estimated at $416,434, approximately $288 per square foot. 830 Zinnia Cir is a home located in Clark County with nearby schools including Sue H. Morrow Elementary School, B Mahlon Brown Academy of International Studies, and Basic Academy of International Studies.
Ownership History
Date
Name
Owned For
Owner Type
Purchase Details
Closed on
Apr 28, 2012
Sold by
Lemley Karen A
Bought by
Lemley Karen Anne and The Karen Anne Lemley Revocable Living T
Current Estimated Value
Purchase Details
Closed on
Feb 7, 2003
Sold by
Castiglione Carla A
Bought by
Lemley Karen A
Home Financials for this Owner
Home Financials are based on the most recent Mortgage that was taken out on this home.
Original Mortgage
$72,000
Interest Rate
5.76%
Purchase Details
Closed on
May 7, 1999
Sold by
Harris Carol Lynn
Bought by
Castiglione Carla A
Home Financials for this Owner
Home Financials are based on the most recent Mortgage that was taken out on this home.
Original Mortgage
$130,113
Interest Rate
6.86%
Mortgage Type
FHA
Purchase Details
Closed on
Dec 20, 1996
Sold by
Seecon Financial & Construction Co Inc
Bought by
Harris Carol Lynn
Home Financials for this Owner
Home Financials are based on the most recent Mortgage that was taken out on this home.
Original Mortgage
$113,950
Interest Rate
7.59%
Create a Home Valuation Report for This Property
The Home Valuation Report is an in-depth analysis detailing your home's value as well as a comparison with similar homes in the area
Home Values in the Area
Average Home Value in this Area
Purchase History
| Date | Buyer | Sale Price | Title Company |
|---|---|---|---|
| Lemley Karen Anne | -- | None Available | |
| Lemley Karen A | $159,900 | First American Title Company | |
| Castiglione Carla A | $131,000 | First American Title Co | |
| Harris Carol Lynn | $120,000 | Old Republic Title Company |
Source: Public Records
Mortgage History
| Date | Status | Borrower | Loan Amount |
|---|---|---|---|
| Closed | Lemley Karen A | $72,000 | |
| Previous Owner | Castiglione Carla A | $130,113 | |
| Previous Owner | Harris Carol Lynn | $113,950 |
Source: Public Records
Tax History Compared to Growth
Tax History
| Year | Tax Paid | Tax Assessment Tax Assessment Total Assessment is a certain percentage of the fair market value that is determined by local assessors to be the total taxable value of land and additions on the property. | Land | Improvement |
|---|---|---|---|---|
| 2025 | $1,447 | $87,109 | $29,400 | $57,709 |
| 2024 | $1,406 | $87,109 | $29,400 | $57,709 |
| 2023 | $1,406 | $88,814 | $33,950 | $54,864 |
| 2022 | $1,365 | $74,327 | $24,150 | $50,177 |
| 2021 | $1,325 | $70,981 | $23,100 | $47,881 |
| 2020 | $1,283 | $69,208 | $21,700 | $47,508 |
| 2019 | $1,246 | $66,212 | $19,250 | $46,962 |
| 2018 | $1,210 | $59,642 | $14,350 | $45,292 |
| 2017 | $1,728 | $59,622 | $13,650 | $45,972 |
| 2016 | $1,147 | $54,280 | $9,100 | $45,180 |
| 2015 | $1,143 | $41,004 | $9,100 | $31,904 |
| 2014 | $1,110 | $40,221 | $7,000 | $33,221 |
Source: Public Records
Map
Nearby Homes
- 233 Mariposa Way
- 263 Prairie Rose St
- 831 Purple Sage Terrace
- 900 Clipper Dr
- 0 Cannes St
- 915 N Major Ave
- 216 Night Fall Terrace
- 947 Clipper Dr
- 914 Palo Verde Dr
- 420 Hidden Brook Ct
- 823 Wintersweet Rd
- 944 River Mountain Dr
- 304 Belfast St
- 308 Belfast St
- 846 Fairview Dr
- 131 Kava St
- 802 Mesa Pine Ct
- 242 Fullerton Ave
- 206 Valerian St
- 857 Bussora Rose Dr
- 828 Zinnia Cir
- 832 Zinnia Cir
- 826 Zinnia Cir
- 834 Zinnia Cir
- 236 Mariposa Way
- 234 Mariposa Way
- 238 Mariposa Way
- 824 Zinnia Cir
- 836 Zinnia Cir
- 831 Zinnia Cir
- 232 Mariposa Way Unit n
- 232 Mariposa Way
- 232 Mariposa Way Unit n/a
- 829 Zinnia Cir
- 833 Zinnia Cir
- 240 Mariposa Way
- 827 Zinnia Cir
- 835 Zinnia Cir
- 825 Zinnia Cir
- 230 Mariposa Way