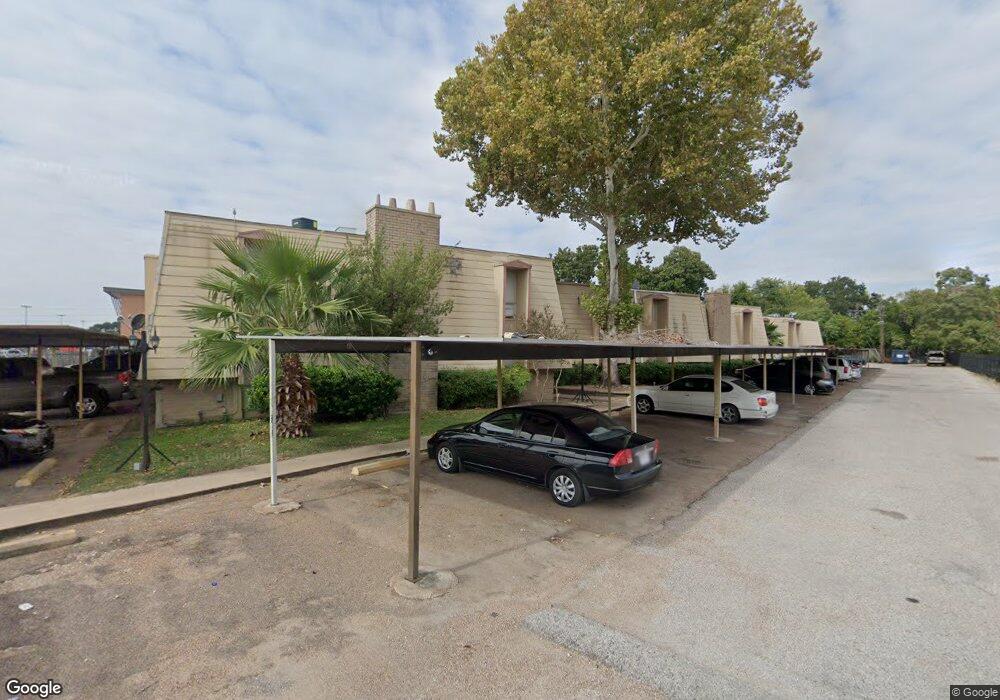
8300 Bellaire Blvd Unit 1 Houston, TX 77036
Sharpstown NeighborhoodEstimated Value: $94,736 - $121,000
2
Beds
2
Baths
936
Sq Ft
$116/Sq Ft
Est. Value
About This Home
This home is located at 8300 Bellaire Blvd Unit 1, Houston, TX 77036 and is currently estimated at $108,934, approximately $116 per square foot. 8300 Bellaire Blvd Unit 1 is a home located in Harris County with nearby schools including Neff Elementary School, Sugar Grove Academy, and Sharpstown High School.
Ownership History
Date
Name
Owned For
Owner Type
Purchase Details
Closed on
Jan 20, 2015
Sold by
Yong Sheng Llc and Leung Mui Ha
Bought by
Blcw Investments Llc
Current Estimated Value
Home Financials for this Owner
Home Financials are based on the most recent Mortgage that was taken out on this home.
Original Mortgage
$5,760,000
Outstanding Balance
$4,432,978
Interest Rate
3.97%
Estimated Equity
-$4,324,044
Purchase Details
Closed on
May 5, 1998
Sold by
Pappas Dena C
Bought by
Nationsbank Na
Purchase Details
Closed on
Dec 18, 1996
Sold by
Hoang Von Trong
Bought by
Nguyen Steve
Purchase Details
Closed on
Nov 26, 1996
Sold by
Mid Ohio Securities Custodian
Bought by
Nguyen Steve and Hoang Von Trong
Purchase Details
Closed on
Oct 3, 1995
Sold by
Welch Maureen Dailey
Bought by
Nationsbank Of Texas Na
Create a Home Valuation Report for This Property
The Home Valuation Report is an in-depth analysis detailing your home's value as well as a comparison with similar homes in the area
Home Values in the Area
Average Home Value in this Area
Purchase History
| Date | Buyer | Sale Price | Title Company |
|---|---|---|---|
| Blcw Investments Llc | -- | American Title Co | |
| Nationsbank Na | $12,400 | -- | |
| Nguyen Steve | -- | -- | |
| Nguyen Steve | -- | -- | |
| Nationsbank Of Texas Na | $10,000 | -- |
Source: Public Records
Mortgage History
| Date | Status | Borrower | Loan Amount |
|---|---|---|---|
| Open | Blcw Investments Llc | $5,760,000 |
Source: Public Records
Tax History Compared to Growth
Tax History
| Year | Tax Paid | Tax Assessment Tax Assessment Total Assessment is a certain percentage of the fair market value that is determined by local assessors to be the total taxable value of land and additions on the property. | Land | Improvement |
|---|---|---|---|---|
| 2025 | $1,330 | $62,825 | $11,937 | $50,888 |
| 2024 | $1,330 | $63,571 | $12,078 | $51,493 |
| 2023 | $1,330 | $64,373 | $12,231 | $52,142 |
| 2022 | $1,355 | $59,369 | $11,280 | $48,089 |
| 2021 | $1,340 | $57,500 | $10,925 | $46,575 |
| 2020 | $1,429 | $69,401 | $13,186 | $56,215 |
| 2019 | $1,432 | $54,848 | $10,421 | $44,427 |
| 2018 | $1,093 | $41,953 | $7,971 | $33,982 |
| 2017 | $854 | $32,722 | $6,217 | $26,505 |
| 2016 | $948 | $36,358 | $6,908 | $29,450 |
| 2015 | -- | $29,065 | $5,522 | $23,543 |
| 2014 | -- | $27,946 | $5,310 | $22,636 |
Source: Public Records
Map
Nearby Homes
- 8314 Edgemoor Dr
- 8515 Edgemoor Dr
- 8527 Edgemoor Dr
- 6602 Harbor Town Dr Unit 1207
- 6602 Harbor Town Dr Unit 1202
- 6411 Redding Rd
- 8530 Roos Rd
- 6500 Harbor Town Dr Unit 3208
- 6500 Harbor Town Dr Unit 2808
- 6500 Harbor Town Dr Unit 3204
- 6500 Harbor Town Dr Unit 3408
- 6500 Harbor Town Dr Unit 2902
- 7302 Redding Rd
- 7302 Burning Tree Dr
- 7819 Bellaire Blvd
- 8826 Rowan Ln
- 8555 Sands Point Dr Unit 90
- 8223 Golf Green Cir
- 8579 Sands Point Dr Unit 102
- 8543 Sands Point Dr
- 8300 Bellaire Blvd Unit 19
- 8300 Bellaire Blvd Unit 22
- 8300 Bellaire Blvd Unit 34
- 8300 Bellaire Blvd Unit 21
- 8300 Bellaire Blvd Unit 20
- 8300 Bellaire Blvd Unit 44
- 8300 Bellaire Blvd Unit 43
- 8300 Bellaire Blvd Unit 42
- 8300 Bellaire Blvd Unit 41
- 8300 Bellaire Blvd Unit 40
- 8300 Bellaire Blvd Unit 39
- 8300 Bellaire Blvd Unit 38
- 8300 Bellaire Blvd Unit 37
- 8300 Bellaire Blvd Unit 36
- 8300 Bellaire Blvd Unit 35
- 8300 Bellaire Blvd Unit 33
- 8300 Bellaire Blvd Unit 32
- 8300 Bellaire Blvd Unit 31
- 8300 Bellaire Blvd Unit 30
- 8300 Bellaire Blvd Unit 29