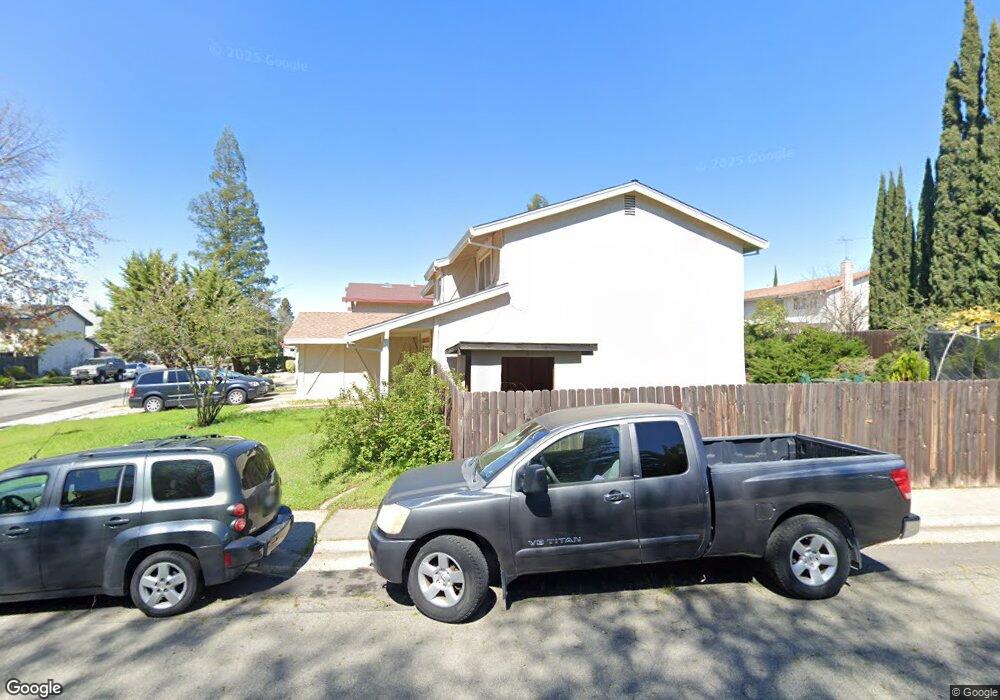
8300 Newbridge Way Citrus Heights, CA 95610
Estimated Value: $539,000 - $642,000
4
Beds
3
Baths
2,185
Sq Ft
$270/Sq Ft
Est. Value
About This Home
This home is located at 8300 Newbridge Way, Citrus Heights, CA 95610 and is currently estimated at $590,922, approximately $270 per square foot. 8300 Newbridge Way is a home located in Sacramento County with nearby schools including Woodside K-8, San Juan High School, and Country Hill Montessori School.
Ownership History
Date
Name
Owned For
Owner Type
Purchase Details
Closed on
Apr 16, 2018
Sold by
Kentera Silvia
Bought by
Kentera Danilo Peter
Current Estimated Value
Purchase Details
Closed on
Jun 2, 2015
Sold by
Kentera Silvia
Bought by
Kentera Silvia and The Silvia Kentera Revocable T
Purchase Details
Closed on
Jul 25, 2005
Sold by
Kentera Peter and Kentera Silvia
Bought by
Kentera Peter and Kentera Silvia
Purchase Details
Closed on
Nov 29, 2004
Sold by
Bidarmaghz Sohrab and Bidarmaghz Jaleh Faridi
Bought by
Kentera Peter and Kentera Silvia
Purchase Details
Closed on
May 2, 2003
Sold by
Bidarmaghz Sohrab and Bidarmaghz Jaleh F
Bought by
Bidarmaghz Sohrab and Bidarmaghz Jaleh
Purchase Details
Closed on
Nov 5, 2002
Sold by
Tan James Tock Pin
Bought by
Bidarmaghz Sohrab and Bidarmaghz Jaleh F
Create a Home Valuation Report for This Property
The Home Valuation Report is an in-depth analysis detailing your home's value as well as a comparison with similar homes in the area
Home Values in the Area
Average Home Value in this Area
Purchase History
| Date | Buyer | Sale Price | Title Company |
|---|---|---|---|
| Kentera Danilo Peter | -- | None Available | |
| Kentera Silvia | -- | None Available | |
| Kentera Silvia | -- | None Available | |
| Kentera Silvia | -- | None Available | |
| Kentera Peter | -- | -- | |
| Kentera Peter | $380,000 | Fidelity National Title Co | |
| Bidarmaghz Sohrab | -- | -- | |
| Bidarmaghz Sohrab | $257,000 | Financial Title Company |
Source: Public Records
Tax History Compared to Growth
Tax History
| Year | Tax Paid | Tax Assessment Tax Assessment Total Assessment is a certain percentage of the fair market value that is determined by local assessors to be the total taxable value of land and additions on the property. | Land | Improvement |
|---|---|---|---|---|
| 2025 | $6,174 | $529,673 | $125,443 | $404,230 |
| 2024 | $6,174 | $519,288 | $122,984 | $396,304 |
| 2023 | $6,016 | $509,107 | $120,573 | $388,534 |
| 2022 | $5,983 | $499,125 | $118,209 | $380,916 |
| 2021 | $5,883 | $489,340 | $115,892 | $373,448 |
| 2020 | $5,772 | $484,323 | $114,704 | $369,619 |
| 2019 | $5,655 | $474,827 | $112,455 | $362,372 |
| 2018 | $5,588 | $465,517 | $110,250 | $355,267 |
| 2017 | $5,256 | $433,864 | $102,756 | $331,108 |
| 2016 | $4,506 | $390,869 | $92,573 | $298,296 |
| 2015 | $4,160 | $361,916 | $85,716 | $276,200 |
| 2014 | $3,954 | $344,682 | $81,634 | $263,048 |
Source: Public Records
Map
Nearby Homes
- 8204 Conover Dr
- 1814 Vista Creek Dr
- 8358 Cedarwood Ln Unit 72
- 8000 Aspen Ln
- 1421 Champion Oaks Dr
- 1527 Crestmont Ave
- 7836 Wintergreen Dr
- 8058 Mesa Oak Way
- 1501 Crestmont Ave
- 143 Olga Way
- 167 Rimma Way
- 21 Olga Way
- 8317 Keyesport Way
- 24 Olga Way
- 8232 Garry Oak Dr
- 156 Rimma Way
- 8206 Peregrine Way
- 1817 Woodacre Way
- 1529 Pine Valley Cir
- 7720 Claypool Way
- 8304 Newbridge Way
- 8301 Northvale Way
- 8305 Northvale Way
- 8308 Newbridge Way
- 8229 Newbridge Way
- 8309 Northvale Way
- 8303 Newbridge Way
- 8311 Newbridge Way
- 8225 Newbridge Way
- 8314 Newbridge Way
- 8315 Northvale Way
- 8221 Newbridge Way
- 8304 Northvale Way
- 8315 Newbridge Way
- 8300 Northvale Way
- 8308 Northvale Way
- 8319 Northvale Way
- 8320 Newbridge Way
- 8312 Northvale Way
- 8217 Newbridge Way