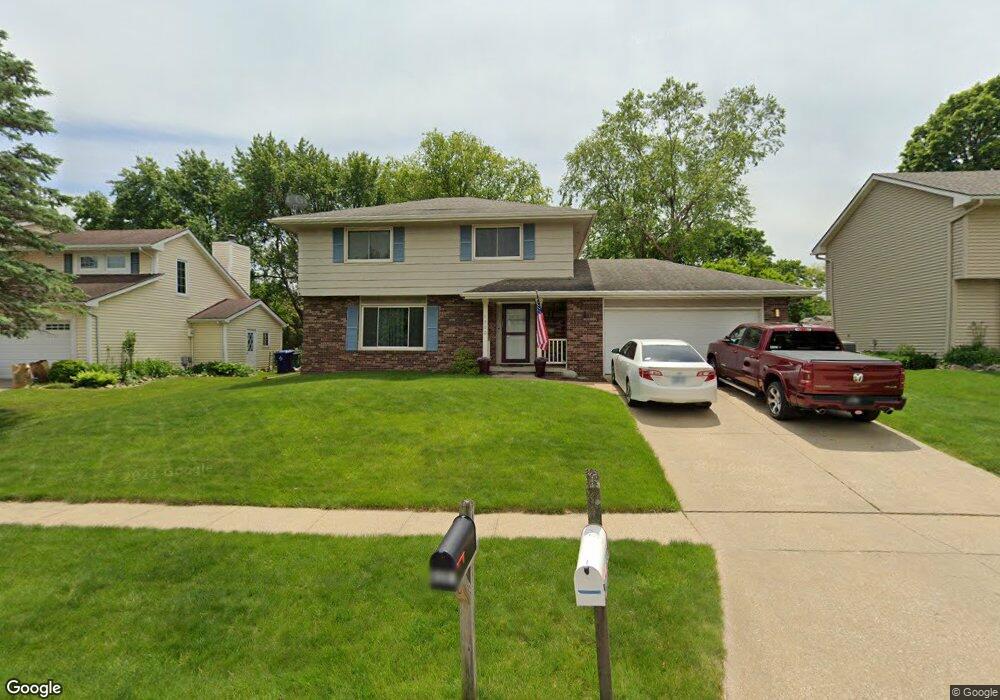
8300 Parkview Dr Urbandale, IA 50322
Estimated Value: $334,000 - $344,000
3
Beds
3
Baths
1,612
Sq Ft
$210/Sq Ft
Est. Value
About This Home
This home is located at 8300 Parkview Dr, Urbandale, IA 50322 and is currently estimated at $337,764, approximately $209 per square foot. 8300 Parkview Dr is a home located in Polk County with nearby schools including Olmsted Elementary School, Urbandale Middle School, and Urbandale High School.
Ownership History
Date
Name
Owned For
Owner Type
Purchase Details
Closed on
May 19, 2004
Sold by
Sharp Christopher W and Sharp Mary E
Bought by
Smith Keith A and Smith Jessica J
Current Estimated Value
Home Financials for this Owner
Home Financials are based on the most recent Mortgage that was taken out on this home.
Original Mortgage
$134,400
Outstanding Balance
$64,826
Interest Rate
5.91%
Mortgage Type
Purchase Money Mortgage
Estimated Equity
$272,938
Purchase Details
Closed on
Jan 14, 2002
Sold by
Dague Richard M and Dague Patricia K
Bought by
Sharp Christopher W and Sharp Mary
Home Financials for this Owner
Home Financials are based on the most recent Mortgage that was taken out on this home.
Original Mortgage
$127,200
Interest Rate
6.92%
Purchase Details
Closed on
Aug 19, 1997
Sold by
Kaven Dennis E and Kaven Ann E
Bought by
Dague Richard M and Dague Lisa M
Home Financials for this Owner
Home Financials are based on the most recent Mortgage that was taken out on this home.
Original Mortgage
$109,200
Interest Rate
7.12%
Create a Home Valuation Report for This Property
The Home Valuation Report is an in-depth analysis detailing your home's value as well as a comparison with similar homes in the area
Home Values in the Area
Average Home Value in this Area
Purchase History
| Date | Buyer | Sale Price | Title Company |
|---|---|---|---|
| Smith Keith A | $167,500 | -- | |
| Sharp Christopher W | $158,500 | -- | |
| Dague Richard M | $136,000 | -- |
Source: Public Records
Mortgage History
| Date | Status | Borrower | Loan Amount |
|---|---|---|---|
| Open | Smith Keith A | $134,400 | |
| Previous Owner | Sharp Christopher W | $127,200 | |
| Previous Owner | Dague Richard M | $109,200 |
Source: Public Records
Tax History Compared to Growth
Tax History
| Year | Tax Paid | Tax Assessment Tax Assessment Total Assessment is a certain percentage of the fair market value that is determined by local assessors to be the total taxable value of land and additions on the property. | Land | Improvement |
|---|---|---|---|---|
| 2025 | $5,346 | $325,100 | $73,700 | $251,400 |
| 2024 | $5,346 | $305,600 | $68,300 | $237,300 |
| 2023 | $5,060 | $305,600 | $68,300 | $237,300 |
| 2022 | $5,000 | $244,700 | $56,300 | $188,400 |
| 2021 | $4,766 | $244,700 | $56,300 | $188,400 |
| 2020 | $4,682 | $221,900 | $51,100 | $170,800 |
| 2019 | $4,474 | $221,900 | $51,100 | $170,800 |
| 2018 | $4,308 | $203,100 | $45,900 | $157,200 |
| 2017 | $4,002 | $203,100 | $45,900 | $157,200 |
| 2016 | $3,898 | $186,000 | $41,700 | $144,300 |
| 2015 | $3,898 | $186,000 | $41,700 | $144,300 |
| 2014 | $3,920 | $185,400 | $38,300 | $147,100 |
Source: Public Records
Map
Nearby Homes
- 8220 Twana Dr
- 4117 83rd St
- 8626 Alpine Dr Unit D
- 8641 Alpine Dr Unit E
- 4480 87th St Unit 10
- 4221 90th St
- 4021 80th St
- 8501 Airline Ave
- 4608 83rd St
- 8119 Goodman Dr
- 8002 Goodman Dr
- 3924 80th St
- 4719 84th St Unit A
- 3900 Rolling Green Dr
- 8217 Oakwood Dr
- 9107 Tanglewood Dr
- 8505 Madison Ave
- 7613 Prairie Ave
- 4421 77th St
- 8523 Hickory Ln
- 8224 Parkview Dr
- 8304 Parkview Dr
- 8308 Parkview Dr
- 8220 Parkview Dr
- 8305 Hammontree Dr
- 8301 Hammontree Dr
- 8309 Hammontree Dr
- 8301 Parkview Dr
- 8225 Hammontree Dr
- 8221 Parkview Dr
- 8305 Parkview Dr
- 8312 Parkview Dr
- 8313 Hammontree Dr
- 8217 Parkview Dr
- 8216 Parkview Dr
- 8309 Parkview Dr
- 8221 Hammontree Dr
- 8316 Parkview Dr
- 8313 Parkview Dr
- 8213 Parkview Dr