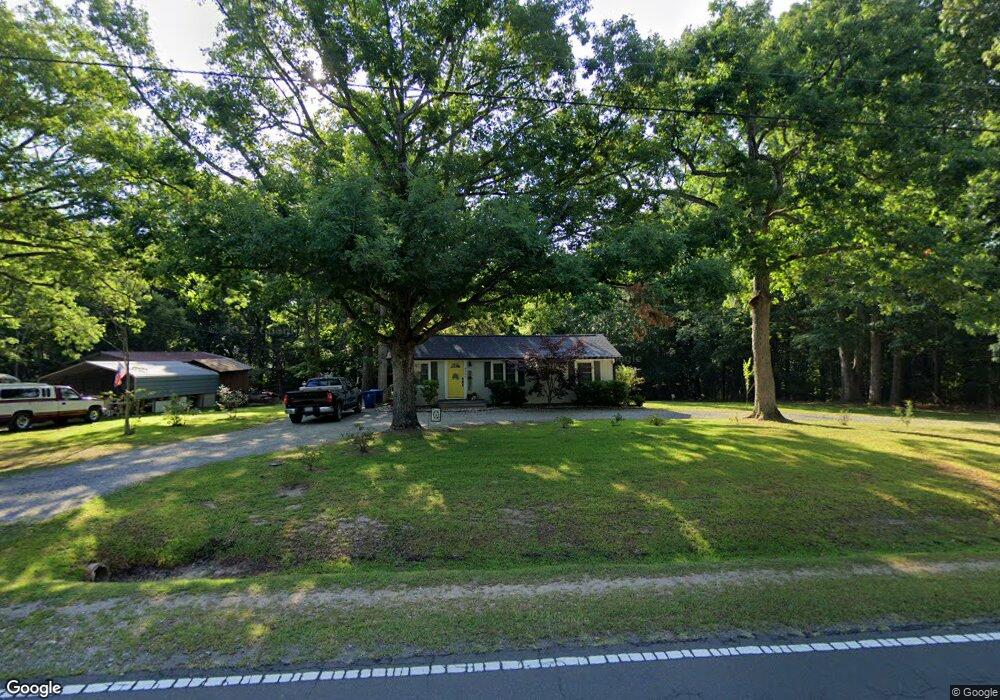
8300 Pinecrest Rd Raleigh, NC 27613
Northwest Raleigh NeighborhoodEstimated Value: $307,000 - $388,000
2
Beds
1
Bath
800
Sq Ft
$428/Sq Ft
Est. Value
About This Home
This home is located at 8300 Pinecrest Rd, Raleigh, NC 27613 and is currently estimated at $342,054, approximately $427 per square foot. 8300 Pinecrest Rd is a home located in Wake County with nearby schools including Leesville Road Elementary School, Leesville Road Middle School, and Leesville Road High School.
Ownership History
Date
Name
Owned For
Owner Type
Purchase Details
Closed on
Apr 7, 2016
Sold by
Pence Micah W and Pence Amy
Bought by
Scotto Michae L David and Klokto Lebasi
Current Estimated Value
Home Financials for this Owner
Home Financials are based on the most recent Mortgage that was taken out on this home.
Original Mortgage
$120,000
Outstanding Balance
$95,333
Interest Rate
3.68%
Mortgage Type
New Conventional
Estimated Equity
$246,721
Purchase Details
Closed on
Dec 22, 2009
Sold by
Anderson Margie M and Anderson James S
Bought by
Pence Micah W
Home Financials for this Owner
Home Financials are based on the most recent Mortgage that was taken out on this home.
Original Mortgage
$125,110
Interest Rate
4.93%
Mortgage Type
New Conventional
Create a Home Valuation Report for This Property
The Home Valuation Report is an in-depth analysis detailing your home's value as well as a comparison with similar homes in the area
Home Values in the Area
Average Home Value in this Area
Purchase History
| Date | Buyer | Sale Price | Title Company |
|---|---|---|---|
| Scotto Michae L David | $150,000 | None Available | |
| Pence Micah W | $125,000 | None Available |
Source: Public Records
Mortgage History
| Date | Status | Borrower | Loan Amount |
|---|---|---|---|
| Open | Scotto Michae L David | $120,000 | |
| Previous Owner | Pence Micah W | $125,110 |
Source: Public Records
Tax History
| Year | Tax Paid | Tax Assessment Tax Assessment Total Assessment is a certain percentage of the fair market value that is determined by local assessors to be the total taxable value of land and additions on the property. | Land | Improvement |
|---|---|---|---|---|
| 2025 | $2,086 | $323,003 | $189,000 | $134,003 |
| 2024 | $2,026 | $323,003 | $189,000 | $134,003 |
Source: Public Records
Map
Nearby Homes
- 8005 Oneal Rd
- 8228 Clarks Branch Dr
- 8600 Colville Ct
- 8309 Tie Stone Way
- 13227 Ashford Park Dr
- 8211 Clasara Cir
- 8609 Leesville Rd
- 9523 Hanging Rock Rd
- 7714 Cloudview Ln
- 9904 Treymore Dr
- 13101 Ashford Park Dr
- 13304 Ashford Park Dr
- 9400 Does Run Ct
- 9200 Colony Village Ln
- 7728 Silver View Ln
- 7617 Derek Dr
- 7751 San Gabriel St
- 8616 Oneal Rd
- 8310 Chimneycap Dr
- 8306 Chimneycap Dr
- 8304 Pinecrest Rd
- 8301 Pinecrest Rd
- 8213 Pinecrest Rd
- 8305 Pinecrest Rd
- 8309 Pinecrest Rd
- 5400 Sylvan Ln
- 8304 Trumpetor Way
- 8300 Trumpetor Way
- 5404 Sylvan Ln
- 5408 Sylvan Ln
- 8308 Trumpetor Way
- 9220 Oneal Rd
- 8301 Trumpetor Way
- 5401 Seafarer Ct
- 5412 Sylvan Ln
- 9221 Oneal Rd
- 8312 Trumpetor Way
- 5401 Sylvan Ln
- 8313 Trumpetor Way
- 8316 Trumpetor Way
Your Personal Tour Guide
Ask me questions while you tour the home.