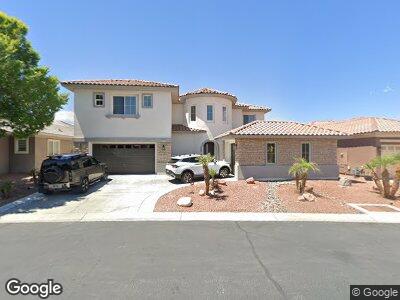
8301 Mount Logan Ct Las Vegas, NV 89131
Tule Springs NeighborhoodEstimated Value: $834,000 - $887,000
4
Beds
4
Baths
3,854
Sq Ft
$223/Sq Ft
Est. Value
About This Home
This home is located at 8301 Mount Logan Ct, Las Vegas, NV 89131 and is currently estimated at $859,297, approximately $222 per square foot. 8301 Mount Logan Ct is a home located in Clark County with nearby schools including Thomas O'Roarke Elementary School, Ralph Cadwallader Middle School, and Arbor View High School.
Ownership History
Date
Name
Owned For
Owner Type
Purchase Details
Closed on
Apr 2, 2024
Sold by
Kucukkoseoglu Ayse
Bought by
Kucukkoseoglu Ayse and Kucukkoseoglu Arman
Current Estimated Value
Purchase Details
Closed on
Mar 17, 2021
Sold by
Kucukkoseoglu Ara Herman
Bought by
Kucukkoseoglu Ayse
Purchase Details
Closed on
Mar 16, 2021
Sold by
Rank Christian L and Rank Linda A
Bought by
Kucukkoseoglu Ayse
Purchase Details
Closed on
Sep 30, 2004
Sold by
Pn Ii Inc
Bought by
Rank Christian L and Rank Linda A
Home Financials for this Owner
Home Financials are based on the most recent Mortgage that was taken out on this home.
Original Mortgage
$554,580
Interest Rate
5.12%
Mortgage Type
Unknown
Create a Home Valuation Report for This Property
The Home Valuation Report is an in-depth analysis detailing your home's value as well as a comparison with similar homes in the area
Home Values in the Area
Average Home Value in this Area
Purchase History
| Date | Buyer | Sale Price | Title Company |
|---|---|---|---|
| Kucukkoseoglu Ayse | -- | None Listed On Document | |
| Kucukkoseoglu Ayse | -- | First American Title Insu | |
| Kucukkoseoglu Ayse | $620,000 | First American Title Insu | |
| Rank Christian L | $647,202 | Lawyers Title Of Nevada |
Source: Public Records
Mortgage History
| Date | Status | Borrower | Loan Amount |
|---|---|---|---|
| Previous Owner | Rank Christian L | $165,000 | |
| Previous Owner | Rank Christian L | $554,580 | |
| Closed | Rank Christian L | $69,322 |
Source: Public Records
Tax History Compared to Growth
Tax History
| Year | Tax Paid | Tax Assessment Tax Assessment Total Assessment is a certain percentage of the fair market value that is determined by local assessors to be the total taxable value of land and additions on the property. | Land | Improvement |
|---|---|---|---|---|
| 2025 | $4,959 | $253,675 | $58,800 | $194,875 |
| 2024 | $4,816 | $253,675 | $58,800 | $194,875 |
| 2023 | $4,816 | $266,342 | $58,433 | $207,909 |
| 2022 | $4,675 | $244,273 | $54,758 | $189,515 |
| 2021 | $4,539 | $202,641 | $50,715 | $151,926 |
| 2020 | $4,404 | $192,760 | $40,425 | $152,335 |
| 2019 | $4,128 | $181,767 | $35,700 | $146,067 |
| 2018 | $3,939 | $171,678 | $33,110 | $138,568 |
| 2017 | $5,528 | $168,636 | $26,950 | $141,686 |
| 2016 | $3,684 | $148,142 | $29,575 | $118,567 |
| 2015 | $3,677 | $123,003 | $21,875 | $101,128 |
| 2014 | $3,570 | $105,662 | $19,688 | $85,974 |
Source: Public Records
Map
Nearby Homes
- 8209 Chapelle Ct
- 7245 Golden Rock Ct
- 7265 Golden Rock Ct
- 7275 Golden Rock Ct
- 7255 Golden Rock Ct
- 7235 Golden Rock Ct
- 7250 Golden Rock Ct
- 7240 Golden Rock Ct
- 7230 Golden Rock Ct
- 7270 Golden Rock Ct
- 7270 Golden Rock Ct
- 7270 Golden Rock Ct
- 8316 Broad Peak Dr
- 8225 Broad Peak Dr
- 7152 Fairwind Acres Place
- 7606 Grove Acre Ct
- 8536 Grand Palms Cir
- 7349 Royal Melbourne Dr
- 7340 Zonal Ave
- 7420 Zonal Ave
- 8301 Mount Logan Ct
- 8305 Mount Logan Ct
- 8221 Mount Logan Ct
- 8217 Mount Logan Ct
- 8309 Mount Logan Ct Unit 1
- 8300 Mount Logan Ct
- 8304 Mount Logan Ct
- 8304 Mount Logan Ct Unit n/a
- 8232 Mount Logan Ct
- 8232 Mount Logan Ct Unit na
- 8213 Mount Logan Ct
- 8308 Mount Logan Ct
- 8226 Mount Logan Ct
- 8220 Mount Logan Ct
- 8301 Oakshire St
- 8209 Mount Logan Ct
- 8305 Oakshire St
- 8312 Mount Logan Ct
- 8312 Mount Logan Ct Unit n/a
- 8233 Oakshire St