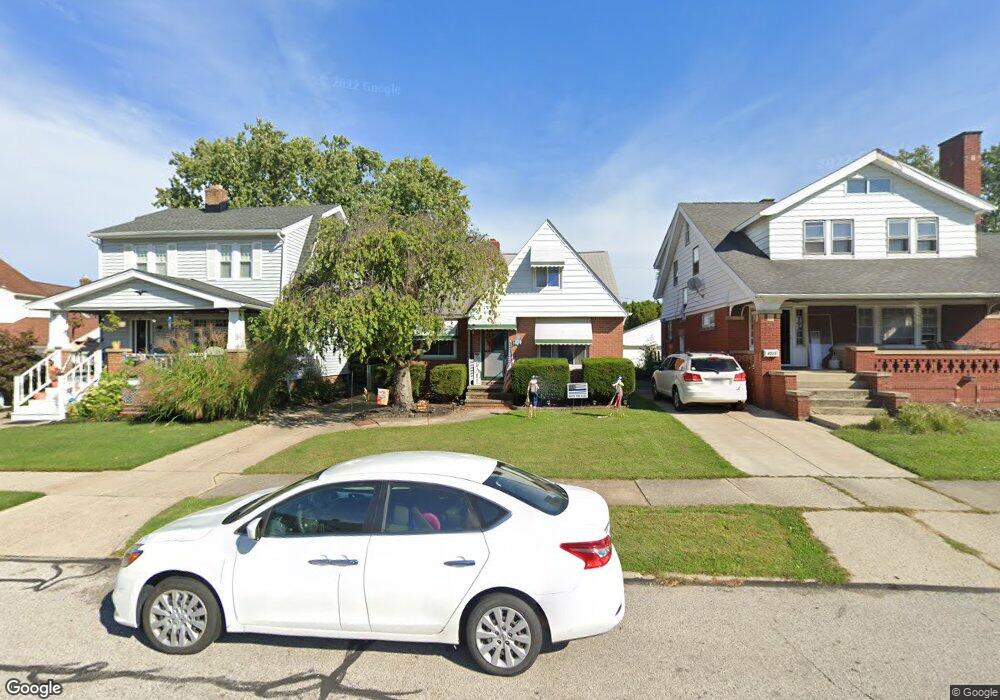
8302 Dorothy Ave Cleveland, OH 44129
Estimated Value: $191,680 - $226,000
3
Beds
1
Bath
1,122
Sq Ft
$183/Sq Ft
Est. Value
About This Home
This home is located at 8302 Dorothy Ave, Cleveland, OH 44129 and is currently estimated at $204,920, approximately $182 per square foot. 8302 Dorothy Ave is a home located in Cuyahoga County with nearby schools including Renwood Elementary School, Thoreau Park Elementary School, and Greenbriar Middle School.
Ownership History
Date
Name
Owned For
Owner Type
Purchase Details
Closed on
Dec 12, 2006
Sold by
Langa Angela M
Bought by
Langa Stephen M
Current Estimated Value
Purchase Details
Closed on
Aug 22, 2000
Sold by
Mincher Derek L and Mincher Linda M
Bought by
Langa Stephen M and Langa Angela M
Home Financials for this Owner
Home Financials are based on the most recent Mortgage that was taken out on this home.
Original Mortgage
$126,000
Interest Rate
8.12%
Purchase Details
Closed on
Jan 28, 1992
Sold by
Ellis Robert D
Bought by
Mincher Derek L
Purchase Details
Closed on
Jul 28, 1987
Sold by
Smith Richard A
Bought by
Ellis Robert D
Purchase Details
Closed on
Aug 8, 1978
Sold by
Mazzeo Ann E and Vito Mazzeo
Bought by
Smith Richard A
Purchase Details
Closed on
Sep 17, 1975
Sold by
Mazzeo Angelo and Mazzeo Ann E
Bought by
Mazzeo Ann E and Vito Mazzeo
Purchase Details
Closed on
Jan 1, 1975
Bought by
Mazzeo Angelo and Mazzeo Ann E
Create a Home Valuation Report for This Property
The Home Valuation Report is an in-depth analysis detailing your home's value as well as a comparison with similar homes in the area
Home Values in the Area
Average Home Value in this Area
Purchase History
| Date | Buyer | Sale Price | Title Company |
|---|---|---|---|
| Langa Stephen M | -- | Attorney | |
| Langa Stephen M | $124,000 | -- | |
| Mincher Derek L | $86,000 | -- | |
| Ellis Robert D | $59,000 | -- | |
| Smith Richard A | $48,900 | -- | |
| Mazzeo Ann E | -- | -- | |
| Mazzeo Angelo | -- | -- |
Source: Public Records
Mortgage History
| Date | Status | Borrower | Loan Amount |
|---|---|---|---|
| Previous Owner | Langa Stephen M | $126,000 |
Source: Public Records
Tax History Compared to Growth
Tax History
| Year | Tax Paid | Tax Assessment Tax Assessment Total Assessment is a certain percentage of the fair market value that is determined by local assessors to be the total taxable value of land and additions on the property. | Land | Improvement |
|---|---|---|---|---|
| 2024 | $3,571 | $58,835 | $10,990 | $47,845 |
| 2023 | $3,179 | $44,940 | $9,730 | $35,210 |
| 2022 | $3,149 | $44,940 | $9,730 | $35,210 |
| 2021 | $3,240 | $44,940 | $9,730 | $35,210 |
| 2020 | $2,836 | $34,580 | $7,490 | $27,090 |
| 2019 | $2,716 | $98,800 | $21,400 | $77,400 |
| 2018 | $2,574 | $34,580 | $7,490 | $27,090 |
| 2017 | $2,579 | $30,380 | $5,810 | $24,570 |
| 2016 | $2,563 | $30,380 | $5,810 | $24,570 |
| 2015 | $2,455 | $30,380 | $5,810 | $24,570 |
| 2014 | $2,455 | $31,020 | $5,920 | $25,100 |
Source: Public Records
Map
Nearby Homes
- 5906 Twin Lakes Dr
- 5972 Westminster Dr
- 5926 Deering Ave
- 5860 Pearl Rd
- 7615 Bertha Ave
- 7514 Spring Garden Rd
- 7910 Dresden Ave
- 5717 Chestnut Dr
- 8514 Deerfield Dr
- 5845 Lotusdale Dr
- 7115 Hampstead Ave
- 7609 Wooster Pkwy
- 7014 Thornton Dr
- 6903 Alber Ave
- 6818 Hampstead Ave
- 9621 Elsmere Dr
- 6136 Ridge Rd
- 6704 Charles Ave
- 6706 Alber Ave
- 6111 Denison Blvd
- 8222 Dorothy Ave
- 8306 Dorothy Ave
- 8218 Dorothy Ave
- 5887 Chestnut Hills Dr
- 5897 Chestnut Hills Dr
- 8214 Dorothy Ave
- 8305 Bertha Ave
- 8221 Bertha Ave
- 5905 Chestnut Hills Dr
- 8215 Bertha Ave
- 5879 Chestnut Hills Dr
- 8219 Dorothy Ave
- 8211 Bertha Ave
- 8206 Dorothy Ave
- 5911 Chestnut Hills Dr
- 8215 Dorothy Ave
- 5875 Chestnut Hills Dr
- 8207 Bertha Ave
- 8202 Dorothy Ave
- 8207 Dorothy Ave