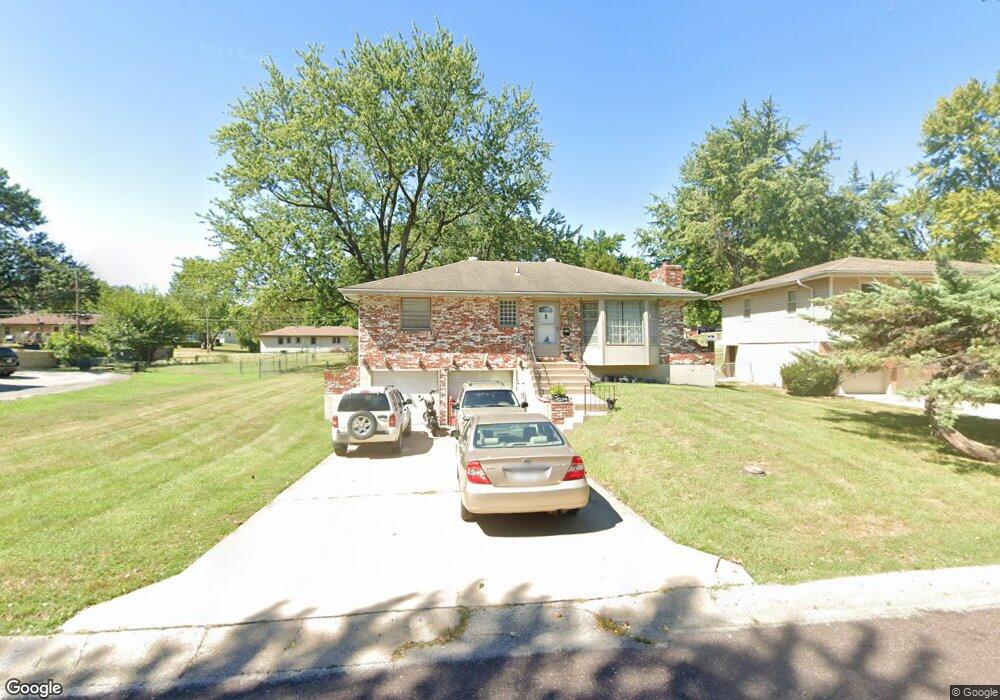
8304 Stark Ave Raytown, MO 64138
Estimated Value: $170,000 - $214,228
2
Beds
1
Bath
1,056
Sq Ft
$191/Sq Ft
Est. Value
About This Home
This home is located at 8304 Stark Ave, Raytown, MO 64138 and is currently estimated at $201,307, approximately $190 per square foot. 8304 Stark Ave is a home located in Jackson County with nearby schools including Spring Valley Elementary, South Middle School, and Carver Christian Academy.
Ownership History
Date
Name
Owned For
Owner Type
Purchase Details
Closed on
May 9, 2022
Sold by
363 Truman Llc
Bought by
South Sommer
Current Estimated Value
Home Financials for this Owner
Home Financials are based on the most recent Mortgage that was taken out on this home.
Original Mortgage
$156,750
Outstanding Balance
$148,936
Interest Rate
5.27%
Mortgage Type
New Conventional
Estimated Equity
$52,371
Purchase Details
Closed on
Feb 22, 2010
Sold by
Myers Gloria L
Bought by
Bealmear Bret
Home Financials for this Owner
Home Financials are based on the most recent Mortgage that was taken out on this home.
Original Mortgage
$62,349
Interest Rate
5.05%
Mortgage Type
FHA
Purchase Details
Closed on
Feb 2, 2009
Sold by
Myers Sheryl K
Bought by
Myers Gloria L
Purchase Details
Closed on
Jul 29, 1997
Sold by
Dewitt Eichmann Jack and Dewitt Jack Dewitt
Bought by
Myers Sheryl K
Home Financials for this Owner
Home Financials are based on the most recent Mortgage that was taken out on this home.
Original Mortgage
$60,000
Interest Rate
7.6%
Mortgage Type
Purchase Money Mortgage
Create a Home Valuation Report for This Property
The Home Valuation Report is an in-depth analysis detailing your home's value as well as a comparison with similar homes in the area
Home Values in the Area
Average Home Value in this Area
Purchase History
| Date | Buyer | Sale Price | Title Company |
|---|---|---|---|
| South Sommer | -- | None Listed On Document | |
| Bealmear Bret | -- | Chicago | |
| Myers Gloria L | $75,000 | None Available | |
| Myers Sheryl K | -- | Coffelt Land Title Inc |
Source: Public Records
Mortgage History
| Date | Status | Borrower | Loan Amount |
|---|---|---|---|
| Open | South Sommer | $156,750 | |
| Previous Owner | Bealmear Bret | $62,349 | |
| Previous Owner | Myers Sheryl K | $60,000 |
Source: Public Records
Tax History Compared to Growth
Tax History
| Year | Tax Paid | Tax Assessment Tax Assessment Total Assessment is a certain percentage of the fair market value that is determined by local assessors to be the total taxable value of land and additions on the property. | Land | Improvement |
|---|---|---|---|---|
| 2025 | $2,481 | $23,619 | $4,769 | $18,850 |
| 2024 | $2,464 | $27,497 | $4,254 | $23,243 |
| 2023 | $2,464 | $27,497 | $3,468 | $24,029 |
| 2022 | $1,680 | $17,860 | $4,835 | $13,025 |
| 2021 | $1,686 | $17,860 | $4,835 | $13,025 |
| 2020 | $1,702 | $17,860 | $4,835 | $13,025 |
| 2019 | $1,693 | $20,665 | $4,835 | $15,830 |
| 2018 | $1,646 | $17,985 | $4,208 | $13,777 |
| 2017 | $1,596 | $17,985 | $4,208 | $13,777 |
| 2016 | $1,596 | $17,535 | $3,131 | $14,404 |
| 2014 | $1,566 | $17,024 | $3,040 | $13,984 |
Source: Public Records
Map
Nearby Homes
- 8811 E 84th St
- 8808 E 84th Terrace
- 8413 Kentucky Ave
- 8819 E 85th St
- 8420 Lane Place
- 8422 Lane Place
- 8816 E 81st St
- 8500 Everett St
- 8512 E 85th St
- 9012 E 85th Terrace
- 8818 E 80th Terrace
- 8540 E 81st Terrace
- 9115 E 84th St
- 8605 Everett St
- 8138 Ditzler Ave
- 8007 Blue Ridge Blvd
- 8711 Stark Ave
- 7901 Tennessee Ave
- 9334 E 85th St
- 8205 E 86th Terrace
- 8306 Stark Ave
- 8302 Stark Ave
- 8303 Stark Ave
- 8305 Stark Ave
- 8308 Stark Ave
- 8300 Stark Ave
- 8307 Stark Ave
- 8301 Stark Ave
- 8310 Stark Ave
- 8309 Stark Ave
- 8305 Spring Valley Rd
- 8307 Spring Valley Rd
- 8303 Spring Valley Rd
- 8302 Kentucky Ave
- 8312 Stark Ave
- 8309 Spring Valley Rd
- 8311 Stark Ave
- 8304 Kentucky Ave
- 8300 Kentucky Ave
- 8306 Kentucky Ave