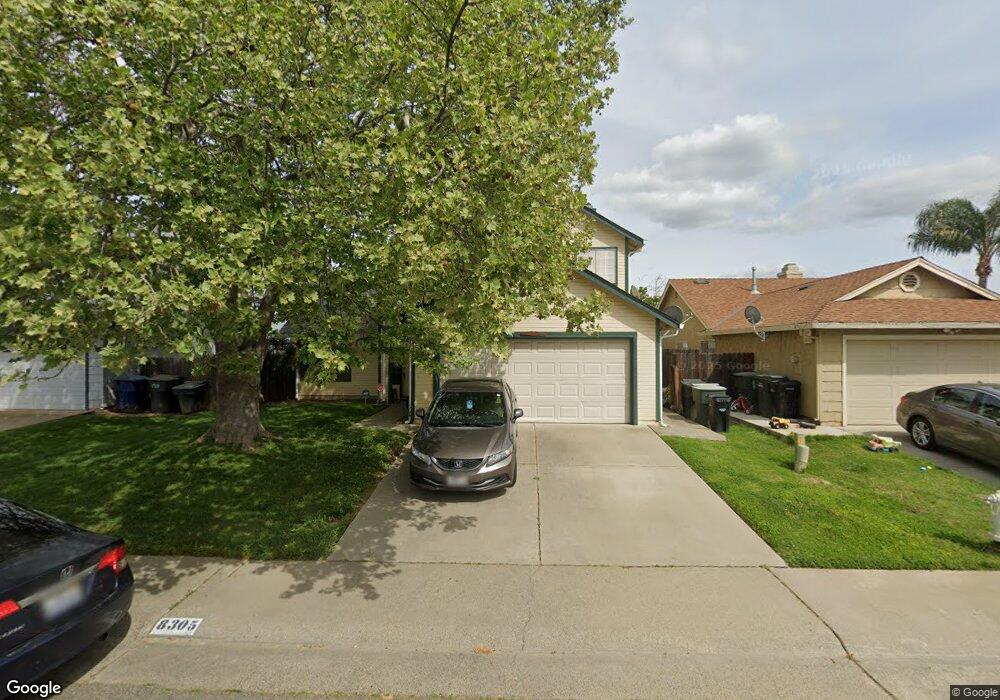
8305 Calla Way Sacramento, CA 95828
Estimated Value: $496,406 - $535,000
4
Beds
3
Baths
1,672
Sq Ft
$310/Sq Ft
Est. Value
About This Home
This home is located at 8305 Calla Way, Sacramento, CA 95828 and is currently estimated at $518,469, approximately $310 per square foot. 8305 Calla Way is a home located in Sacramento County with nearby schools including Isabelle Jackson Elementary School, Edward Harris Jr. Middle School, and Monterey Trail High School.
Ownership History
Date
Name
Owned For
Owner Type
Purchase Details
Closed on
Mar 31, 2013
Sold by
Forward Margo and Myles Benjamin
Bought by
Myles Margo Forward
Current Estimated Value
Purchase Details
Closed on
Sep 16, 2004
Sold by
Forward Margo T and Myles Benjamen
Bought by
Forward Margo T
Home Financials for this Owner
Home Financials are based on the most recent Mortgage that was taken out on this home.
Original Mortgage
$50,000
Outstanding Balance
$24,573
Interest Rate
5.76%
Mortgage Type
Credit Line Revolving
Estimated Equity
$493,896
Purchase Details
Closed on
Sep 23, 1998
Sold by
Hud
Bought by
Forward Margo T
Home Financials for this Owner
Home Financials are based on the most recent Mortgage that was taken out on this home.
Original Mortgage
$124,336
Outstanding Balance
$26,514
Interest Rate
6.88%
Mortgage Type
FHA
Estimated Equity
$491,955
Purchase Details
Closed on
Mar 23, 1998
Sold by
Lewis David R and Lewis Carla R
Bought by
Source One Mtg Services Corp
Purchase Details
Closed on
Feb 27, 1998
Sold by
Source One Mtg Services Corp
Bought by
Hud
Create a Home Valuation Report for This Property
The Home Valuation Report is an in-depth analysis detailing your home's value as well as a comparison with similar homes in the area
Home Values in the Area
Average Home Value in this Area
Purchase History
| Date | Buyer | Sale Price | Title Company |
|---|---|---|---|
| Myles Margo Forward | -- | None Available | |
| Forward Margo T | -- | -- | |
| Forward Margo T | $122,500 | Stewart Title | |
| Source One Mtg Services Corp | $115,070 | Fidelity National Title Ins | |
| Hud | -- | Fidelity National Title Ins |
Source: Public Records
Mortgage History
| Date | Status | Borrower | Loan Amount |
|---|---|---|---|
| Open | Forward Margo T | $50,000 | |
| Open | Forward Margo T | $124,336 |
Source: Public Records
Tax History Compared to Growth
Tax History
| Year | Tax Paid | Tax Assessment Tax Assessment Total Assessment is a certain percentage of the fair market value that is determined by local assessors to be the total taxable value of land and additions on the property. | Land | Improvement |
|---|---|---|---|---|
| 2025 | $4,835 | $191,401 | $62,695 | $128,706 |
| 2024 | $4,835 | $187,649 | $61,466 | $126,183 |
| 2023 | $4,783 | $183,970 | $60,261 | $123,709 |
| 2022 | $4,748 | $180,364 | $59,080 | $121,284 |
| 2021 | $4,726 | $176,828 | $57,922 | $118,906 |
| 2020 | $4,700 | $175,016 | $57,329 | $117,687 |
| 2019 | $4,665 | $171,585 | $56,205 | $115,380 |
| 2018 | $4,614 | $168,221 | $55,103 | $113,118 |
| 2017 | $1,994 | $164,923 | $54,023 | $110,900 |
| 2016 | $1,901 | $161,690 | $52,964 | $108,726 |
| 2015 | $1,869 | $159,262 | $52,169 | $107,093 |
| 2014 | $1,841 | $156,144 | $51,148 | $104,996 |
Source: Public Records
Map
Nearby Homes
- 8317 Honeycomb Way
- 8336 Cutler Way
- 8251 Apple Cove Ct
- 8186 Gustine Way
- 8437 Yermo Way
- 8012 Northern Oak Cir
- 8077 Goran Ct
- 8346 Floxtree Ct
- 7905 Springarden Way
- 8233 Short Rd
- 7901 Stevenson Ave
- 8095 E Stockton Blvd
- 7715 Cotton Ln
- 8216 Exbourne Cir
- 8266 Summer Sunset Dr
- 8476 W Stockton Blvd Unit 1
- 8510 Cavendish Way
- 8336 Summer Sunset Dr
- 8282 Union Creek Way
- 8159 Morgan Hill Way
- 8301 Calla Way
- 8309 Calla Way
- 8372 Auberry Dr
- 8368 Auberry Dr
- 8313 Calla Way
- 8293 Calla Way
- 8280 Calla Way
- 8376 Auberry Dr
- 8364 Auberry Dr
- 8322 Calla Way
- 8380 Auberry Dr
- 8360 Auberry Dr
- 8289 Calla Way
- 8276 Calla Way
- 8326 Calla Way
- 8384 Auberry Dr
- 8285 Calla Way
- 8317 Calla Way
- 8356 Auberry Dr
- 8281 Calla Way