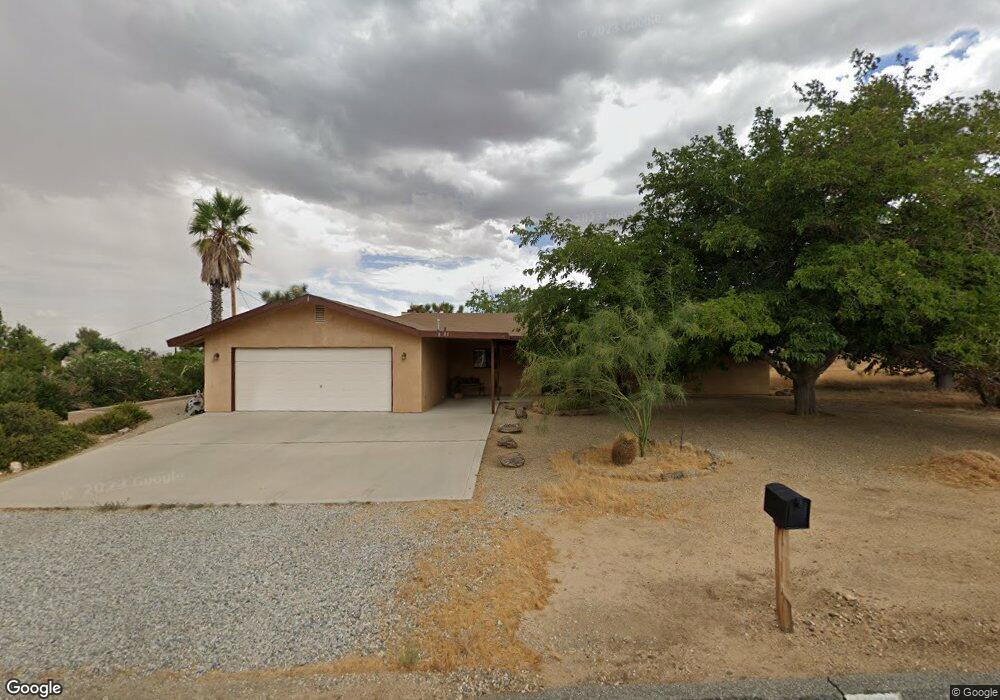
8305 Cholla Ave Yucca Valley, CA 92284
Estimated Value: $304,000 - $366,359
3
Beds
2
Baths
1,620
Sq Ft
$205/Sq Ft
Est. Value
About This Home
This home is located at 8305 Cholla Ave, Yucca Valley, CA 92284 and is currently estimated at $332,590, approximately $205 per square foot. 8305 Cholla Ave is a home located in San Bernardino County with nearby schools including Onaga Elementary School, La Contenta Middle School, and Yucca Valley High School.
Ownership History
Date
Name
Owned For
Owner Type
Purchase Details
Closed on
Sep 17, 2024
Sold by
Susan L Baines Trust and Baines Benjamin Barlow
Bought by
Villanueva Cornett Alyssia and Lee Cornett Clayton
Current Estimated Value
Home Financials for this Owner
Home Financials are based on the most recent Mortgage that was taken out on this home.
Original Mortgage
$307,878
Outstanding Balance
$304,411
Interest Rate
6.46%
Mortgage Type
New Conventional
Estimated Equity
$28,179
Purchase Details
Closed on
Apr 5, 2024
Sold by
Baines Susan L
Bought by
Susan L Baines Trust and Baines
Purchase Details
Closed on
Aug 19, 2016
Sold by
Baines Susan L and The Janice E Leach Revocable T
Bought by
Baines Susan L
Purchase Details
Closed on
Sep 9, 1993
Sold by
Leach Janice E
Bought by
Leach Janice E and Janice E Leach Revocable Trust
Create a Home Valuation Report for This Property
The Home Valuation Report is an in-depth analysis detailing your home's value as well as a comparison with similar homes in the area
Home Values in the Area
Average Home Value in this Area
Purchase History
| Date | Buyer | Sale Price | Title Company |
|---|---|---|---|
| Villanueva Cornett Alyssia | $305,000 | Orange Coast Title Company | |
| Susan L Baines Trust | -- | None Listed On Document | |
| Baines Susan L | -- | None Available | |
| Leach Janice E | -- | -- |
Source: Public Records
Mortgage History
| Date | Status | Borrower | Loan Amount |
|---|---|---|---|
| Open | Villanueva Cornett Alyssia | $307,878 |
Source: Public Records
Tax History Compared to Growth
Tax History
| Year | Tax Paid | Tax Assessment Tax Assessment Total Assessment is a certain percentage of the fair market value that is determined by local assessors to be the total taxable value of land and additions on the property. | Land | Improvement |
|---|---|---|---|---|
| 2025 | $2,727 | $305,000 | $61,000 | $244,000 |
| 2024 | $2,727 | $191,496 | $23,210 | $168,286 |
| 2023 | $2,608 | $187,741 | $22,755 | $164,986 |
| 2022 | $2,483 | $184,060 | $22,309 | $161,751 |
| 2021 | $2,492 | $180,451 | $21,872 | $158,579 |
| 2020 | $2,472 | $178,601 | $21,648 | $156,953 |
| 2019 | $2,363 | $175,099 | $21,224 | $153,875 |
| 2018 | $2,144 | $171,666 | $20,808 | $150,858 |
| 2017 | $2,024 | $168,300 | $20,400 | $147,900 |
| 2016 | $1,993 | $165,345 | $21,968 | $143,377 |
| 2015 | $1,948 | $162,861 | $21,638 | $141,223 |
| 2014 | $1,929 | $159,671 | $21,214 | $138,457 |
Source: Public Records
Map
Nearby Homes
- 56455 Carlyle Dr
- 56434 Desert Gold Dr
- 56488 El Dorado Dr
- 56595 Desert Gold Dr
- 56320 Tamarisk Ct
- 56643 Desert Gold Dr
- 56661 Desert Gold Dr
- 56662 El Dorado Dr
- 8305 Amador Ave
- 0 Church Ct
- 56616 Joshua Dr
- 0 Piute Trail Unit IG25231697
- 56620 Hidden Gold Dr
- 56740 Free Gold Dr
- 56766 Bonanza Dr
- 8053 Amador Ave
- 56811 Desert Gold Dr
- 7991 Amador Ave
- 56838 Bonanza Dr
- 7995 Grand Ave
- 56423 Carlyle Dr
- 56435 Carlyle Dr
- 56413 Desert Gold Dr
- 56396 Carlyle Dr
- 56437 Desert Gold Dr
- 56450 Desert Gold Dr
- 8297 Tamarisk Ave
- 56469 Carlyle Dr
- 8289 Tamarisk Ave
- 56459 Desert Gold Dr
- 8272 Cholla Ave
- 8237 Cholla Ave
- 8361 Cholla Ave
- 56446 El Dorado Dr
- 8271 Tamarisk Ave
- 56454 Carlyle Dr
- 8256 Cholla Ave
- 56386 Carlyle Dr
- 56485 Carlyle Dr
- 56485 Desert Gold Dr