
Seller's Agent in 2019
Tom Rickey
RE/MAX Professionals
(253) 318-0036
12 in this area
60 Total Sales
Estimated Value: $648,000 - $666,574
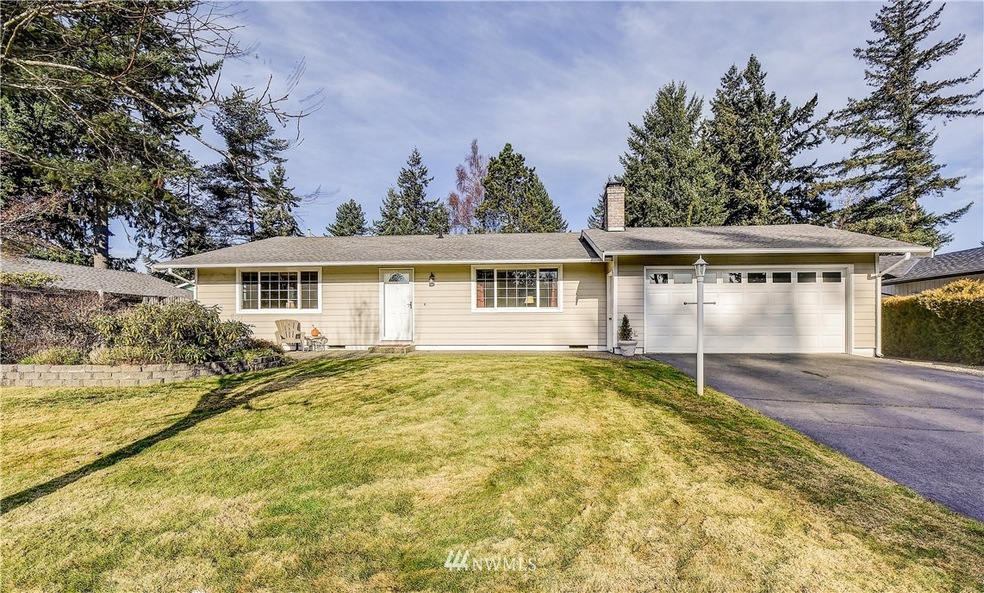
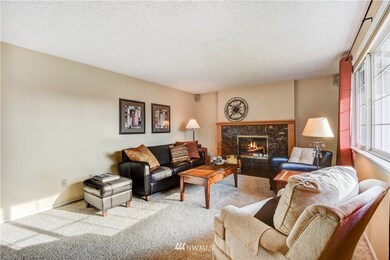
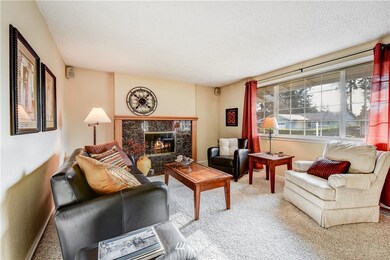
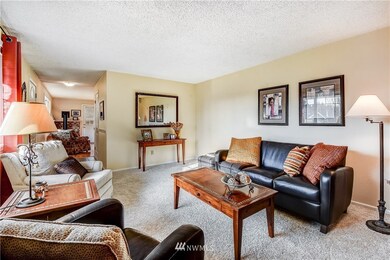
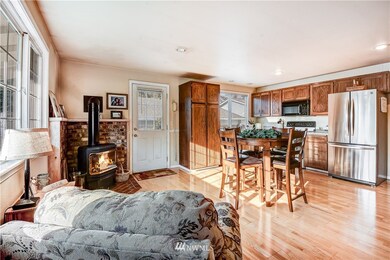
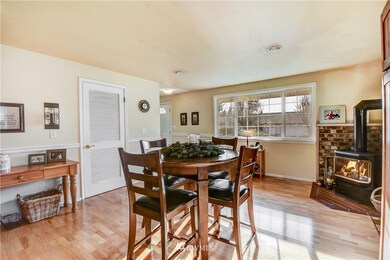
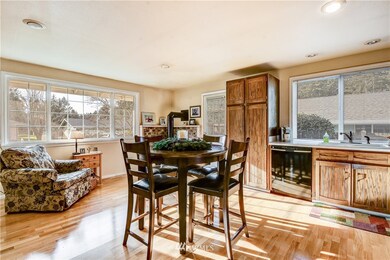
A Rambler in University Place! 3 Bedroom 2 Bath home & 4 covered parking spaces! 2 car garage plus permitted 2-car carport & built-in storage. RV parking benefits from second rear access to the property. Eat-in kitchen with comfortable gas fireplace stove. Custom remodel added a large Rec Room + built-ins & Vaulted ceiling. Good size bedrooms plus Office. Located in a quiet University Place neighborhood on cul-d-sac. Seller purchased abandoned alley behind the home to increase size of the lot.
Last Buyer's Agent
Alyson Peters
Better Homes and Gardens RE PC License #126616
Source: Northwest Multiple Listing Service (NWMLS)
MLS#: 1545264
| Date | Buyer | Sale Price | Title Company |
|---|---|---|---|
| Barde Ross | $437,100 | Wfg Natl Ttl Co Of Wa Llc |
| Date | Event | Price | List to Sale | Price per Sq Ft |
|---|---|---|---|---|
| 12/26/2019 12/26/19 | Sold | $437,100 | +2.2% | $234 / Sq Ft |
| 12/10/2019 12/10/19 | Pending | -- | -- | -- |
| 12/02/2019 12/02/19 | For Sale | $427,500 | -- | $229 / Sq Ft |
| Year | Tax Paid | Tax Assessment Tax Assessment Total Assessment is a certain percentage of the fair market value that is determined by local assessors to be the total taxable value of land and additions on the property. | Land | Improvement |
|---|---|---|---|---|
| 2025 | $6,151 | $613,000 | $283,100 | $329,900 |
| 2024 | $6,151 | $593,900 | $278,500 | $315,400 |
| 2023 | $6,151 | $515,700 | $267,400 | $248,300 |
| 2022 | $6,085 | $573,000 | $283,200 | $289,800 |
| 2021 | $5,702 | $410,900 | $187,400 | $223,500 |
| 2019 | $4,737 | $386,600 | $160,200 | $226,400 |
| 2018 | $4,865 | $365,500 | $146,400 | $219,100 |
| 2017 | $4,474 | $309,600 | $114,300 | $195,300 |
| 2016 | $3,733 | $243,600 | $78,300 | $165,300 |
| 2014 | $3,692 | $212,400 | $66,500 | $145,900 |
| 2013 | $3,692 | $221,100 | $78,300 | $142,800 |
Seller's Agent in 2019
Tom Rickey
RE/MAX Professionals
(253) 318-0036
12 in this area
60 Total Sales
A
Buyer's Agent in 2019
Alyson Peters
Better Homes and Gardens RE PC
Source: Northwest Multiple Listing Service (NWMLS)
MLS Number: 1545264
APN: 210100-0044
Disclaimer: Certain information contained herein is derived from information provided by parties other than Homes.com. All information provided is deemed reliable, but is not guaranteed to be accurate and should be independently verified.
![]() All data is obtained from various sources and may not have been verified by broker or MLS GRID. Supplied Open House Information is subject to change without notice. All information should be independently reviewed and verified for accuracy. Properties may or may not be listed by the office/agent presenting the information. Listing information is provided by the Northwest Multiple Listing Service (NWMLS). Property information is based on available data that may include MLS information, county records, and other sources. Listings marked with the 3 tree icon and provided by NWMLS. All properties are subject to prior sale or withdrawal. IDX information is provided exclusively for consumers’ personal noncommercial use, that it may not be used for any purpose other than to identify prospective properties consumers may be interested in purchasing, that the data is deemed reliable but is not guaranteed by MLS GRID. ©2025 NWMLS.
All data is obtained from various sources and may not have been verified by broker or MLS GRID. Supplied Open House Information is subject to change without notice. All information should be independently reviewed and verified for accuracy. Properties may or may not be listed by the office/agent presenting the information. Listing information is provided by the Northwest Multiple Listing Service (NWMLS). Property information is based on available data that may include MLS information, county records, and other sources. Listings marked with the 3 tree icon and provided by NWMLS. All properties are subject to prior sale or withdrawal. IDX information is provided exclusively for consumers’ personal noncommercial use, that it may not be used for any purpose other than to identify prospective properties consumers may be interested in purchasing, that the data is deemed reliable but is not guaranteed by MLS GRID. ©2025 NWMLS.
Based on information submitted to the MLS GRID