Estimated Value: $560,000 - $1,019,673
3
Beds
2
Baths
1,808
Sq Ft
$428/Sq Ft
Est. Value
About This Home
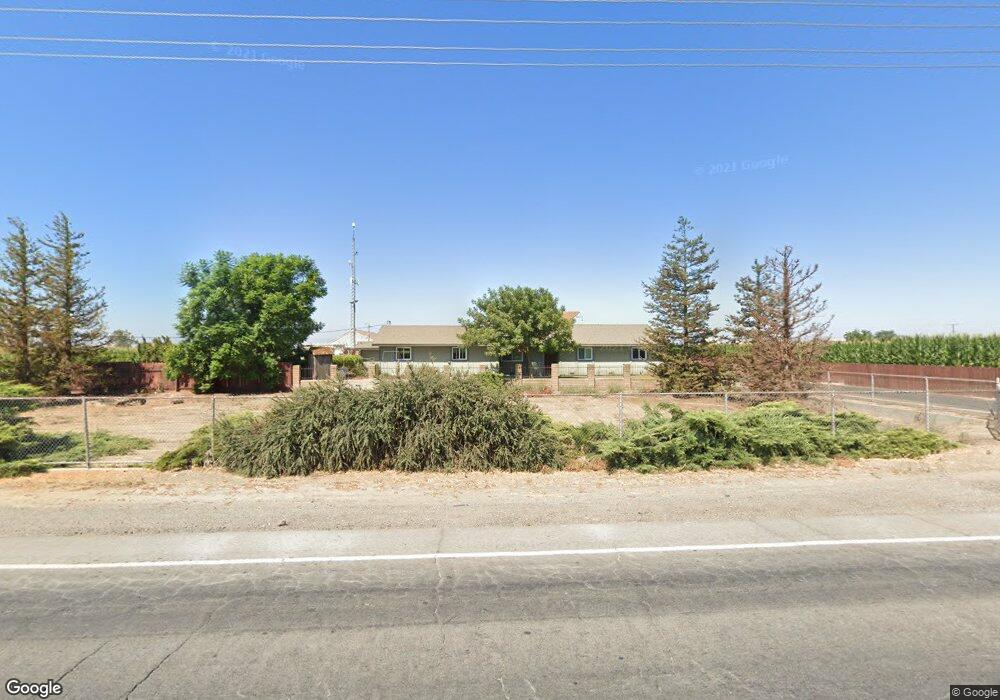
This home is located at 8307 Crows Landing Rd, Ceres, CA 95307 and is currently estimated at $773,558, approximately $427 per square foot. 8307 Crows Landing Rd is a home located in Stanislaus County with nearby schools including Chatom Elementary School, Mountain View Middle School, and Turlock Junior High School.
Ownership History
Date
Name
Owned For
Owner Type
Purchase Details
Closed on
Jul 6, 2020
Sold by
Souza Joe A and Souza Margaret M
Bought by
Souza Joe A and Souza Margaret M
Current Estimated Value
Home Financials for this Owner
Home Financials are based on the most recent Mortgage that was taken out on this home.
Original Mortgage
$232,000
Interest Rate
3.1%
Mortgage Type
Credit Line Revolving
Purchase Details
Closed on
Oct 24, 2013
Sold by
Souza Joe A
Bought by
Souza Joe A and Souza Margaret M
Purchase Details
Closed on
Jul 31, 2002
Sold by
Souza Margaret M and Souza Joe A
Bought by
Souza Joe A and Souza Margaret M
Purchase Details
Closed on
Jul 19, 2002
Sold by
Souza Margaret M
Bought by
Souza Margaret M
Create a Home Valuation Report for This Property
The Home Valuation Report is an in-depth analysis detailing your home's value as well as a comparison with similar homes in the area
Purchase History
| Date | Buyer | Sale Price | Title Company |
|---|---|---|---|
| Souza Joe A | -- | Old Republic Title Company | |
| Souza Joe A | -- | None Available | |
| Souza Joe A | -- | -- | |
| Souza Margaret M | -- | -- |
Source: Public Records
Mortgage History
| Date | Status | Borrower | Loan Amount |
|---|---|---|---|
| Closed | Souza Joe A | $232,000 |
Source: Public Records
Tax History
| Year | Tax Paid | Tax Assessment Tax Assessment Total Assessment is a certain percentage of the fair market value that is determined by local assessors to be the total taxable value of land and additions on the property. | Land | Improvement |
|---|---|---|---|---|
| 2025 | $6,536 | $589,774 | $353,832 | $235,942 |
| 2024 | $6,653 | $606,319 | $375,003 | $231,316 |
| 2023 | $6,808 | $609,488 | $382,707 | $226,781 |
| 2022 | $6,741 | $600,362 | $378,027 | $222,335 |
| 2021 | $6,512 | $575,996 | $358,020 | $217,976 |
| 2020 | $6,292 | $556,289 | $340,548 | $215,741 |
| 2019 | $6,092 | $534,963 | $323,452 | $211,511 |
| 2018 | $5,498 | $466,834 | $259,470 | $207,364 |
| 2017 | $5,036 | $428,796 | $225,497 | $203,299 |
| 2016 | $4,815 | $415,210 | $215,897 | $199,313 |
| 2015 | $4,812 | $411,458 | $215,138 | $196,320 |
| 2014 | $4,711 | $401,736 | $206,448 | $195,288 |
Source: Public Records
Map
Nearby Homes
- 1237 W Keyes Rd
- 8631 Mitchell Rd
- 5237 Crows Landing Rd
- 2030 E Grayson Rd Unit 42
- 2030 E Grayson Rd Unit 44
- 2030 E Grayson Rd Unit 26
- 2030 E Grayson Rd Unit 41
- 4396 Admiral Ct
- 4376 Admiral Ct
- 1279 Montclaire Dr
- 4449 S Carpenter Rd Unit B12
- 4449 S Carpenter Rd Unit C-1
- 1440 Don Pedro Rd
- 3816 Teek Ct
- 3816 Dano Ct
- 3608 Cassie Ln
- 1628 Sungate Dr
- 3939 Central Ave Unit 157
- 3939 Central Ave Unit 126
- 3939 Central Ave Unit 35
- 8218 Crows Landing Rd
- 8406 Crows Landing Rd
- 8207 Crows Landing Rd
- 106 W Tuolumne Rd
- 8524 Crows Landing Rd
- 407 W Tuolumne Rd
- 324 W Tuolumne Rd
- 8554 Crows Landing Rd
- 413 W Tuolumne Rd
- 412 W Tuolumne Rd
- 137 E Monte Vista Rd
- 8637 Crows Landing Rd
- 7925 Crows Landing Rd
- 412 W Monte Vista Rd
- 243 E Monte Vista Rd
- 613 W Tuolumne Rd
- 313 E Monte Vista Rd
- 348 E Monte Vista Rd
- 8639 Crows Landing Rd
- 700 W Tuolumne Rd
Your Personal Tour Guide
Ask me questions while you tour the home.