Estimated Value: $124,000 - $316,000
4
Beds
2
Baths
1,118
Sq Ft
$230/Sq Ft
Est. Value
About This Home
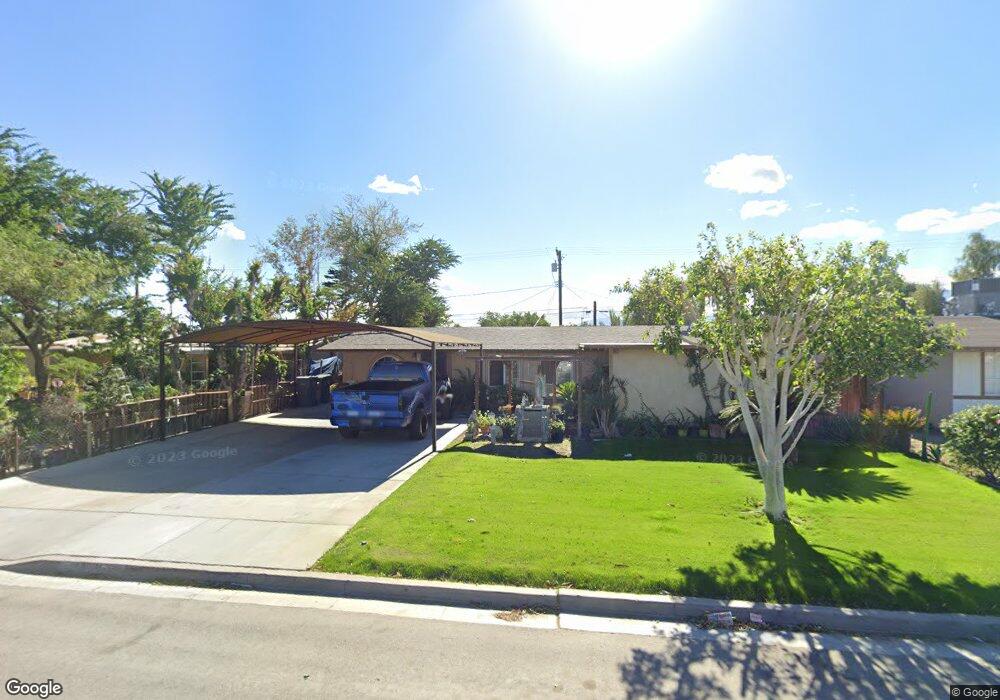
This home is located at 83071 Emerald Ave, Indio, CA 92201 and is currently estimated at $256,704, approximately $229 per square foot. 83071 Emerald Ave is a home located in Riverside County with nearby schools including Richard R. Oliphant Elementary, Desert Ridge Academy, and Shadow Hills High School.
Ownership History
Date
Name
Owned For
Owner Type
Purchase Details
Closed on
Aug 22, 2014
Sold by
Chavez Cynthia and Chavez Federico
Bought by
Chavez Federico and Chavez Cynthia
Current Estimated Value
Home Financials for this Owner
Home Financials are based on the most recent Mortgage that was taken out on this home.
Original Mortgage
$96,500
Interest Rate
4.09%
Mortgage Type
New Conventional
Purchase Details
Closed on
Sep 20, 2008
Sold by
Castro Aurora and Chavez Cynthia
Bought by
Chavez Cynthia and Chavez Federico
Purchase Details
Closed on
Nov 13, 1998
Sold by
Chavez Cynthia
Bought by
Castro Aurora and Chavez Cynthia
Home Financials for this Owner
Home Financials are based on the most recent Mortgage that was taken out on this home.
Original Mortgage
$18,670
Interest Rate
6.42%
Purchase Details
Closed on
Mar 21, 1996
Sold by
Castro Aurora and Castro Arturo
Bought by
Castro Aurora and Chavez Cynthia
Create a Home Valuation Report for This Property
The Home Valuation Report is an in-depth analysis detailing your home's value as well as a comparison with similar homes in the area
Home Values in the Area
Average Home Value in this Area
Purchase History
| Date | Buyer | Sale Price | Title Company |
|---|---|---|---|
| Chavez Federico | -- | Ticor Title Company | |
| Chavez Cynthia | -- | None Available | |
| Castro Aurora | -- | Commonwealth Land Title Co | |
| Castro Aurora | -- | -- |
Source: Public Records
Mortgage History
| Date | Status | Borrower | Loan Amount |
|---|---|---|---|
| Closed | Chavez Federico | $96,500 | |
| Closed | Castro Aurora | $18,670 |
Source: Public Records
Tax History
| Year | Tax Paid | Tax Assessment Tax Assessment Total Assessment is a certain percentage of the fair market value that is determined by local assessors to be the total taxable value of land and additions on the property. | Land | Improvement |
|---|---|---|---|---|
| 2025 | $2,257 | $76,029 | $17,450 | $58,579 |
| 2023 | $2,257 | $73,078 | $16,773 | $56,305 |
| 2022 | $1,998 | $71,646 | $16,445 | $55,201 |
| 2021 | $1,873 | $70,242 | $16,123 | $54,119 |
| 2020 | $1,586 | $69,523 | $15,958 | $53,565 |
| 2019 | $1,531 | $68,161 | $15,646 | $52,515 |
| 2018 | $1,468 | $66,826 | $15,341 | $51,485 |
| 2017 | $1,271 | $65,517 | $15,041 | $50,476 |
| 2016 | $1,260 | $64,234 | $14,747 | $49,487 |
| 2015 | $1,215 | $63,272 | $14,527 | $48,745 |
| 2014 | $1,285 | $62,035 | $14,244 | $47,791 |
Source: Public Records
Map
Nearby Homes
- 83160 Tourmaline Ave
- 44095 Faye St
- 44093 Faye St
- 05 Dillon Ave
- 43965 Towne St
- 83335 Avenue 45
- 83037 Avenue 44
- 82489 Valencia Ave
- 43419 Deglet Noor St
- 45741 Smurr St
- 44725 Palm St
- 0 Palm St
- 82625 Requa Ave
- 42912 Gazapo Ct
- 1 Oasis St
- 43175 Avenida Estrella
- 83773 Salva Ct
- 45671 Deglet Noor St
- 82180 Valencia Ave
- 83414 Skyline Trail Rd
- 83061 Emerald Ave
- 83081 Emerald Ave
- 83092 Ruby Ave
- 83091 Emerald Ave
- 83084 Ruby Ave
- 83104 Ruby Ave
- 83072 Ruby Ave
- 83070 Emerald Ave
- 83116 Ruby Ave
- 83041 Emerald Ave
- 83101 Emerald Ave
- 83060 Emerald Ave
- 83080 Emerald Ave
- 83050 Emerald Ave
- 83064 Ruby Ave
- 83090 Emerald Ave
- 83128 Ruby Ave
- 83111 Emerald Ave
- 83040 Emerald Ave
- 83100 Emerald Ave
Your Personal Tour Guide
Ask me questions while you tour the home.