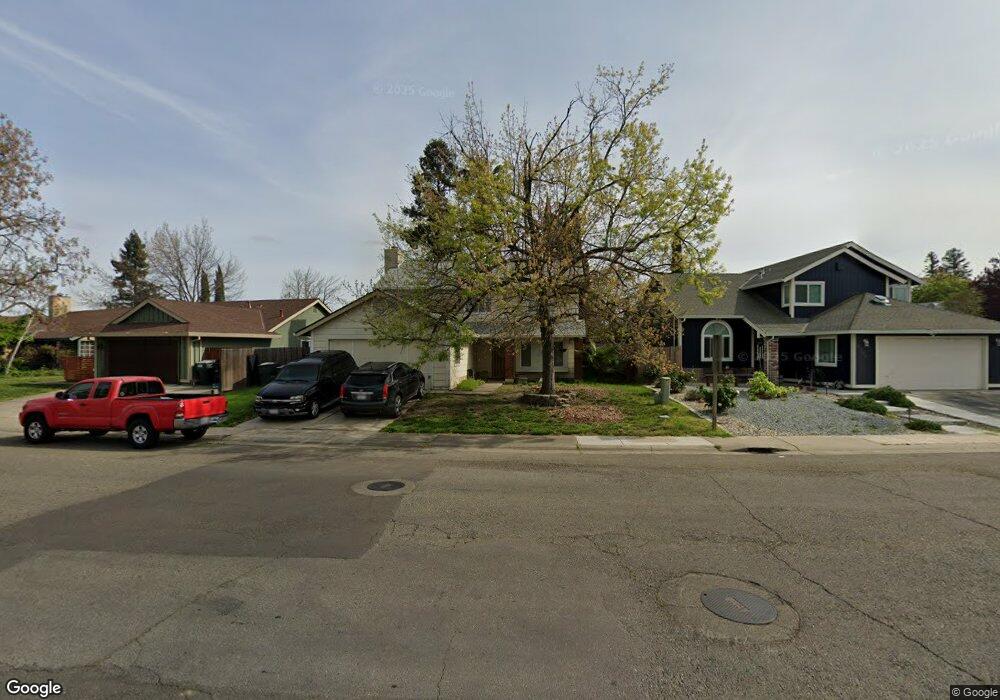
8308 Cutler Way Sacramento, CA 95828
Estimated Value: $355,000 - $535,000
4
Beds
3
Baths
1,656
Sq Ft
$288/Sq Ft
Est. Value
About This Home
This home is located at 8308 Cutler Way, Sacramento, CA 95828 and is currently estimated at $477,385, approximately $288 per square foot. 8308 Cutler Way is a home located in Sacramento County with nearby schools including Isabelle Jackson Elementary School, James Rutter Middle School, and Florin High School.
Ownership History
Date
Name
Owned For
Owner Type
Purchase Details
Closed on
Apr 16, 2025
Sold by
Galindo Kerri
Bought by
Morrow Joy K
Current Estimated Value
Home Financials for this Owner
Home Financials are based on the most recent Mortgage that was taken out on this home.
Original Mortgage
$80,000
Outstanding Balance
$79,573
Interest Rate
6.65%
Mortgage Type
Credit Line Revolving
Estimated Equity
$397,812
Purchase Details
Closed on
Apr 9, 2015
Sold by
Morrow Joy K and Bekoff Morrow Joy
Bought by
Morrow Joy K
Home Financials for this Owner
Home Financials are based on the most recent Mortgage that was taken out on this home.
Original Mortgage
$155,677
Interest Rate
3.75%
Mortgage Type
FHA
Purchase Details
Closed on
Dec 18, 2014
Sold by
Bekoff Mark W
Bought by
Bekoff Morrow Joy
Create a Home Valuation Report for This Property
The Home Valuation Report is an in-depth analysis detailing your home's value as well as a comparison with similar homes in the area
Home Values in the Area
Average Home Value in this Area
Purchase History
| Date | Buyer | Sale Price | Title Company |
|---|---|---|---|
| Morrow Joy K | -- | Placer Title | |
| Morrow Joy K | -- | First American Title | |
| Bekoff Morrow Joy | -- | First American Title |
Source: Public Records
Mortgage History
| Date | Status | Borrower | Loan Amount |
|---|---|---|---|
| Open | Morrow Joy K | $80,000 | |
| Previous Owner | Morrow Joy K | $155,677 |
Source: Public Records
Tax History Compared to Growth
Tax History
| Year | Tax Paid | Tax Assessment Tax Assessment Total Assessment is a certain percentage of the fair market value that is determined by local assessors to be the total taxable value of land and additions on the property. | Land | Improvement |
|---|---|---|---|---|
| 2025 | $4,759 | $277,879 | $76,620 | $201,259 |
| 2024 | $4,759 | $272,431 | $75,118 | $197,313 |
| 2023 | $4,307 | $267,091 | $73,646 | $193,445 |
| 2022 | $3,965 | $261,854 | $72,202 | $189,652 |
| 2021 | $3,865 | $256,721 | $70,787 | $185,934 |
| 2020 | $6,145 | $254,090 | $70,062 | $184,028 |
| 2019 | $4,298 | $249,109 | $68,689 | $180,420 |
| 2018 | $4,208 | $244,226 | $67,343 | $176,883 |
| 2017 | $4,154 | $239,438 | $66,023 | $173,415 |
| 2016 | $4,227 | $234,744 | $64,729 | $170,015 |
| 2015 | $2,607 | $232,456 | $67,524 | $164,932 |
| 2014 | $3,787 | $227,904 | $66,202 | $161,702 |
Source: Public Records
Map
Nearby Homes
- 8336 Cutler Way
- 8251 Apple Cove Ct
- 8437 Yermo Way
- 8317 Honeycomb Way
- 8186 Gustine Way
- 8346 Floxtree Ct
- 8329 Spengler Dr
- 7905 Springarden Way
- 8077 Goran Ct
- 8233 Short Rd
- 8266 Summer Sunset Dr
- 8336 Summer Sunset Dr
- 8510 Cavendish Way
- 8282 Union Creek Way
- 7901 Stevenson Ave
- 8216 Exbourne Cir
- 8159 Morgan Hill Way
- 4.13 ACR Lenhart Rd
- 8095 E Stockton Blvd
- 8548 Whitby Ct
- 8312 Cutler Way
- 8304 Cutler Way
- 8316 Cutler Way
- 8331 Herndon Ct
- 8327 Herndon Ct
- 8305 Auberry Dr
- 8301 Auberry Dr
- 8356 Boron Way
- 8309 Auberry Dr
- 8335 Herndon Ct
- 8320 Cutler Way
- 8313 Auberry Dr
- 8277 Auberry Dr
- 8352 Boron Way
- 8154 Tecopa Way
- 8324 Cutler Way
- 8158 Tecopa Way
- 8273 Auberry Dr
- 8348 Boron Way
- 8328 Herndon Ct