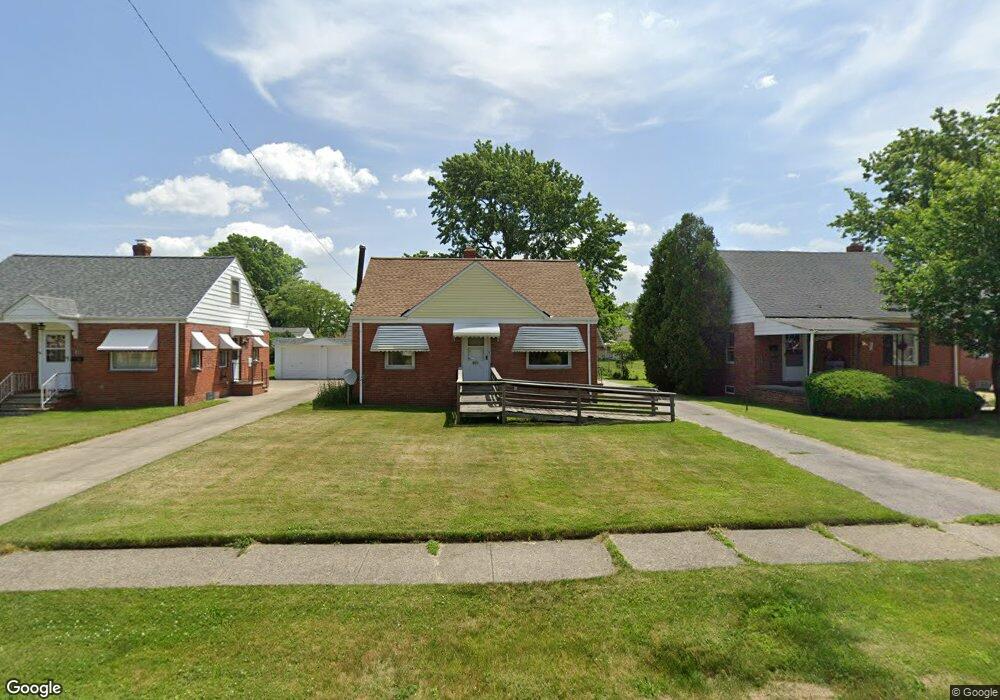
831 E 256th St Euclid, OH 44132
Estimated Value: $122,950 - $146,000
3
Beds
1
Bath
1,170
Sq Ft
$115/Sq Ft
Est. Value
About This Home
This home is located at 831 E 256th St, Euclid, OH 44132 and is currently estimated at $134,988, approximately $115 per square foot. 831 E 256th St is a home located in Cuyahoga County with nearby schools including Shoreview Elementary School, Euclid High School, and Pinnacle Academy.
Ownership History
Date
Name
Owned For
Owner Type
Purchase Details
Closed on
Aug 7, 2012
Sold by
Mikolay Steven A
Bought by
Mikolay Steven A and Docktor Thomas G
Current Estimated Value
Purchase Details
Closed on
Apr 11, 2007
Sold by
Seibert Lisa
Bought by
Mikolay Steven A
Purchase Details
Closed on
Aug 29, 2002
Sold by
Mikolay Steven A
Bought by
Seibert Lisa and Kravanis Dalton Lee
Purchase Details
Closed on
Feb 2, 1990
Sold by
Ehman William
Bought by
Mikolay Steven A
Purchase Details
Closed on
Jun 23, 1981
Sold by
Ehman William
Bought by
Ehman William
Purchase Details
Closed on
May 23, 1979
Sold by
Ehman William and Ehman Anna
Bought by
Ehman William
Purchase Details
Closed on
Jan 1, 1975
Bought by
Ehman William and Ehman Anna
Create a Home Valuation Report for This Property
The Home Valuation Report is an in-depth analysis detailing your home's value as well as a comparison with similar homes in the area
Home Values in the Area
Average Home Value in this Area
Purchase History
| Date | Buyer | Sale Price | Title Company |
|---|---|---|---|
| Mikolay Steven A | -- | Attorney | |
| Mikolay Steven A | -- | Attorney | |
| Seibert Lisa | -- | -- | |
| Mikolay Steven A | -- | -- | |
| Ehman William | -- | -- | |
| Ehman William | -- | -- | |
| Ehman William | -- | -- |
Source: Public Records
Tax History
| Year | Tax Paid | Tax Assessment Tax Assessment Total Assessment is a certain percentage of the fair market value that is determined by local assessors to be the total taxable value of land and additions on the property. | Land | Improvement |
|---|---|---|---|---|
| 2024 | $2,280 | $42,210 | $9,100 | $33,110 |
| 2023 | $1,748 | $28,570 | $6,900 | $21,670 |
| 2022 | $1,743 | $28,560 | $6,900 | $21,670 |
| 2021 | $1,932 | $28,560 | $6,900 | $21,670 |
| 2020 | $1,719 | $24,640 | $5,950 | $18,690 |
| 2019 | $1,542 | $70,400 | $17,000 | $53,400 |
| 2018 | $1,553 | $24,640 | $5,950 | $18,690 |
| 2017 | $1,354 | $20,130 | $4,940 | $15,190 |
| 2016 | $2,293 | $20,130 | $4,940 | $15,190 |
| 2015 | $1,334 | $20,130 | $4,940 | $15,190 |
| 2014 | $1,334 | $21,080 | $4,940 | $16,140 |
Source: Public Records
Map
Nearby Homes
- 825 E 256th St
- 25650 Richards Ave
- 25700 Briardale Ave
- 25751 Briardale Ave
- 24571 Alberton Rd
- 890 E 250th St
- 643 E 261st St
- 26430 Drakefield Ave
- 515 E 250th St
- 25671 Farringdon Ave
- 579 E 260th St
- 24181 Devoe Ave
- 25401 Farringdon Ave
- 571 E 260th St
- 26351 Farringdon Ave
- 464 E 250th St
- 25731 Zeman Ave
- 815 E 272nd St
- 25151 Zeman Ave
- 24891 Zeman Ave
Your Personal Tour Guide
Ask me questions while you tour the home.