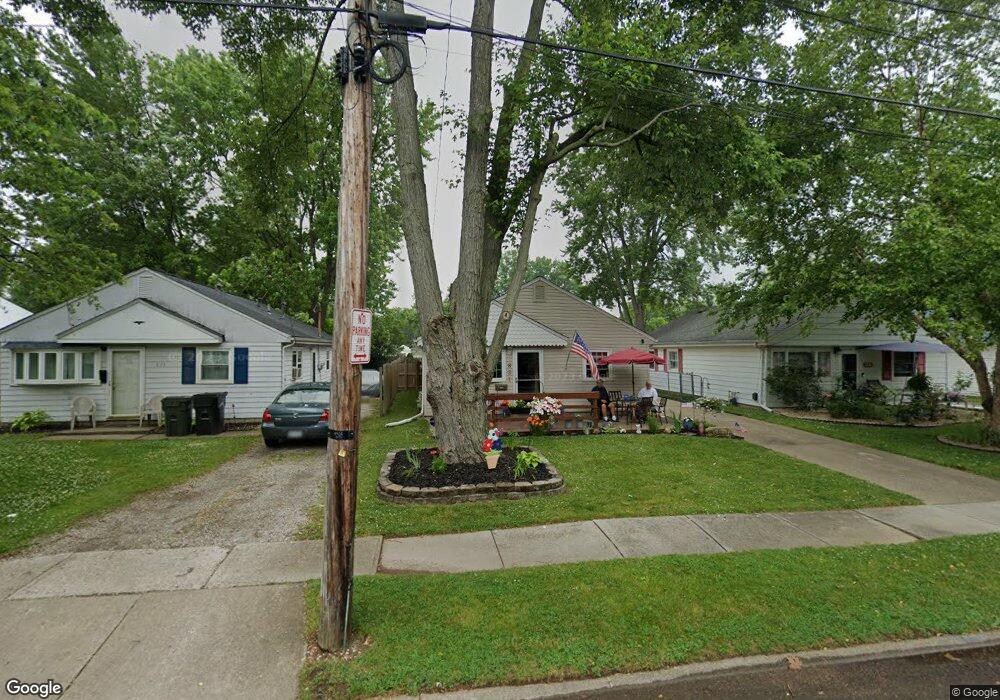
831 S Logan St Elyria, OH 44035
Estimated Value: $144,755 - $164,000
3
Beds
1
Bath
925
Sq Ft
$166/Sq Ft
Est. Value
About This Home
This home is located at 831 S Logan St, Elyria, OH 44035 and is currently estimated at $153,939, approximately $166 per square foot. 831 S Logan St is a home located in Lorain County with nearby schools including Eastern Heights Middle School, Elyria High School, and Constellation Schools: Elyria Community Elementary.
Ownership History
Date
Name
Owned For
Owner Type
Purchase Details
Closed on
Jul 2, 2007
Sold by
Chini Denise
Bought by
Marian Dominic R and Marian Sharon L
Current Estimated Value
Home Financials for this Owner
Home Financials are based on the most recent Mortgage that was taken out on this home.
Original Mortgage
$82,400
Outstanding Balance
$50,854
Interest Rate
6.26%
Mortgage Type
Purchase Money Mortgage
Estimated Equity
$103,085
Purchase Details
Closed on
Jul 1, 2007
Sold by
Chini Carl F
Bought by
Chini Denise
Home Financials for this Owner
Home Financials are based on the most recent Mortgage that was taken out on this home.
Original Mortgage
$82,400
Outstanding Balance
$50,854
Interest Rate
6.26%
Mortgage Type
Purchase Money Mortgage
Estimated Equity
$103,085
Create a Home Valuation Report for This Property
The Home Valuation Report is an in-depth analysis detailing your home's value as well as a comparison with similar homes in the area
Home Values in the Area
Average Home Value in this Area
Purchase History
| Date | Buyer | Sale Price | Title Company |
|---|---|---|---|
| Marian Dominic R | $82,400 | Multiple | |
| Chini Denise | -- | Multiple |
Source: Public Records
Mortgage History
| Date | Status | Borrower | Loan Amount |
|---|---|---|---|
| Open | Marian Dominic R | $82,400 |
Source: Public Records
Tax History
| Year | Tax Paid | Tax Assessment Tax Assessment Total Assessment is a certain percentage of the fair market value that is determined by local assessors to be the total taxable value of land and additions on the property. | Land | Improvement |
|---|---|---|---|---|
| 2024 | $1,332 | $37,944 | $7,518 | $30,426 |
| 2023 | $1,082 | $29,026 | $6,076 | $22,950 |
| 2022 | $1,101 | $29,026 | $6,076 | $22,950 |
| 2021 | $1,104 | $29,026 | $6,076 | $22,950 |
| 2020 | $854 | $22,710 | $4,750 | $17,960 |
| 2019 | $849 | $22,710 | $4,750 | $17,960 |
| 2018 | $760 | $22,710 | $4,750 | $17,960 |
| 2017 | $669 | $19,280 | $4,820 | $14,460 |
| 2016 | $660 | $19,280 | $4,820 | $14,460 |
| 2015 | $619 | $19,280 | $4,820 | $14,460 |
| 2014 | $654 | $20,020 | $5,000 | $15,020 |
| 2013 | $648 | $20,020 | $5,000 | $15,020 |
Source: Public Records
Map
Nearby Homes
- 832 S Logan St
- 828 S Logan St
- 800 Boston Ave
- 908 Baldwin Ave
- 340 Boston Ave
- 560 Case Ave
- 154 Bentley Dr
- 553 Purdue Ave
- 539 Princeton Ave
- 523 Purdue Ave
- 1210 Prospect St
- 350 Concord Ave
- 453 Kenyon Ave
- 217 Syracuse Ct
- 347 Kenyon Ave
- 239 Syracuse Ct
- 321 Kansas Ave
- 418 Carol Ln
- 475 Carol Ln
- 209 Clark St