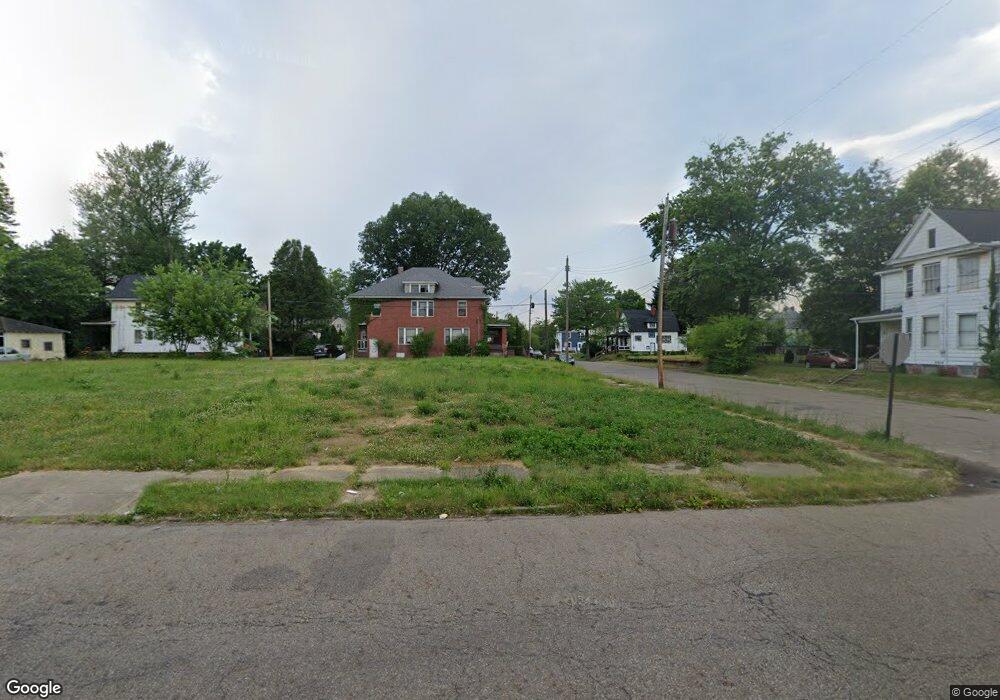
831 Shorb Ave NW Canton, OH 44703
Summit NeighborhoodEstimated Value: $46,404 - $160,000
6
Beds
3
Baths
3,312
Sq Ft
$33/Sq Ft
Est. Value
About This Home
This home is located at 831 Shorb Ave NW, Canton, OH 44703 and is currently estimated at $108,851, approximately $32 per square foot. 831 Shorb Ave NW is a home located in Stark County with nearby schools including Early Learning Center @ Schreiber, Gibbs Elementary School, and Clarendon Intermediate School.
Ownership History
Date
Name
Owned For
Owner Type
Purchase Details
Closed on
Aug 24, 2011
Sold by
Stewart Katherine E
Bought by
Fannie Mae and Federal National Mortgage Association
Current Estimated Value
Purchase Details
Closed on
Jun 1, 2010
Sold by
Gaw Kathleen J
Bought by
Stewart Katherine E
Purchase Details
Closed on
Dec 10, 2002
Sold by
Dye Richard E and Dye Joanna L
Bought by
Stewart Katherine E and Gaw Kathleen J
Home Financials for this Owner
Home Financials are based on the most recent Mortgage that was taken out on this home.
Original Mortgage
$49,600
Interest Rate
6.25%
Mortgage Type
Purchase Money Mortgage
Purchase Details
Closed on
Jun 28, 1996
Sold by
King Dale B
Bought by
Dye Richard E
Home Financials for this Owner
Home Financials are based on the most recent Mortgage that was taken out on this home.
Original Mortgage
$52,750
Interest Rate
8.13%
Mortgage Type
FHA
Create a Home Valuation Report for This Property
The Home Valuation Report is an in-depth analysis detailing your home's value as well as a comparison with similar homes in the area
Home Values in the Area
Average Home Value in this Area
Purchase History
| Date | Buyer | Sale Price | Title Company |
|---|---|---|---|
| Fannie Mae | $32,000 | Attorney | |
| Stewart Katherine E | $148,700 | Attorney | |
| Stewart Katherine E | $62,000 | Union Title Co | |
| Dye Richard E | $52,900 | -- |
Source: Public Records
Mortgage History
| Date | Status | Borrower | Loan Amount |
|---|---|---|---|
| Previous Owner | Stewart Katherine E | $49,600 | |
| Previous Owner | Dye Richard E | $52,750 |
Source: Public Records
Tax History Compared to Growth
Tax History
| Year | Tax Paid | Tax Assessment Tax Assessment Total Assessment is a certain percentage of the fair market value that is determined by local assessors to be the total taxable value of land and additions on the property. | Land | Improvement |
|---|---|---|---|---|
| 2025 | $31,443 | $1,790 | $1,790 | -- |
| 2024 | $28,730 | $1,790 | $1,790 | -- |
| 2023 | $27,983 | $10,050 | $2,170 | $7,880 |
| 2022 | $2,504 | $10,050 | $2,170 | $7,880 |
| 2021 | $607 | $10,050 | $2,170 | $7,880 |
| 2020 | $655 | $9,730 | $2,100 | $7,630 |
| 2019 | $974 | $9,730 | $2,100 | $7,630 |
| 2018 | $578 | $9,730 | $2,100 | $7,630 |
| 2017 | $689 | $10,570 | $2,310 | $8,260 |
| 2016 | $1,156 | $15,890 | $2,310 | $13,580 |
| 2015 | $1,042 | $15,890 | $2,310 | $13,580 |
| 2014 | $1,329 | $19,150 | $2,770 | $16,380 |
| 2013 | $643 | $19,150 | $2,770 | $16,380 |
Source: Public Records
Map
Nearby Homes
- 806 Troy Place NW
- 811 Troy Place NW
- 905 High Ave NW
- 722 High Ave NW
- 824 12th St NW
- 916 6th St NW
- 1005 Dewalt Ave NW
- 1007 Dewalt Ave NW
- 1023 Fulton Rd NW
- 1221 9th St NW
- 1227 Worley Ave NW
- 1231 Worley Ave NW
- 1015 4th St NW
- 413 Newton Ave NW
- 1306 12th St NW
- 1224 Cleveland Ave NW
- 1024 3rd St NW
- 1405 8th St NW
- 1409 8th St NW
- 935 Ridge Rd NW
- 829 Shorb Ave NW
- 826 Clover Ct NW
- 901 Shorb Ave NW
- 914 9th St NW
- 907 Shorb Ave NW
- 819 Shorb Ave NW
- 832 Shorb Ave NW
- 915 Wilson Place NW
- 915 9th St NW
- 920 9th St NW
- 900 Shorb Ave NW
- 828 Shorb Ave NW
- 910 Herbert Place NW
- 815 Shorb Ave NW
- 824 Shorb Ave NW
- 924 9th St NW
- 830 9th St NW
- 912 Herbert Place NW
- 818 Shorb Ave NW
- 818 Shorb Ave NW Unit 3