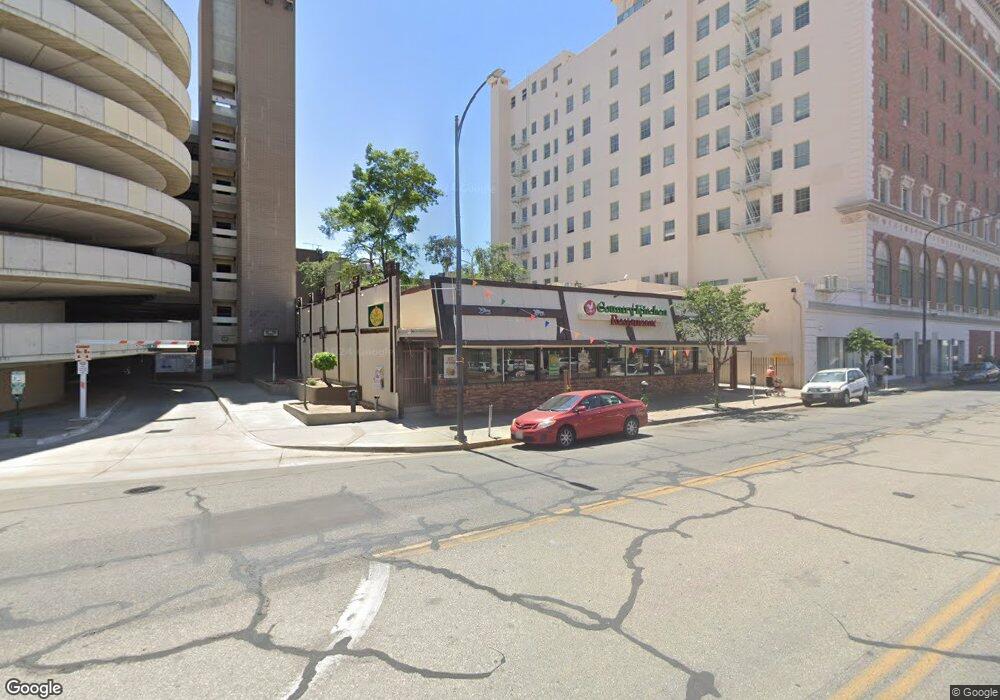
831 Van Ness Ave Fresno, CA 93721
Downtown Fresno NeighborhoodEstimated Value: $1,095,653
--
Bed
--
Bath
4,511
Sq Ft
$243/Sq Ft
Est. Value
About This Home
This home is located at 831 Van Ness Ave, Fresno, CA 93721 and is currently estimated at $1,095,653, approximately $242 per square foot. 831 Van Ness Ave is a home located in Fresno County with nearby schools including Jefferson Elementary School, Tehipite Middle School, and Roosevelt High School.
Ownership History
Date
Name
Owned For
Owner Type
Purchase Details
Closed on
Oct 22, 2024
Sold by
Amani Investment Inc and Mahmoud Sakeb
Bought by
Morales Frisly Roel Diaz
Current Estimated Value
Home Financials for this Owner
Home Financials are based on the most recent Mortgage that was taken out on this home.
Original Mortgage
$915,000
Outstanding Balance
$905,105
Interest Rate
6.2%
Mortgage Type
Seller Take Back
Estimated Equity
$190,549
Purchase Details
Closed on
Aug 31, 2023
Sold by
Anaya Family Living Trust
Bought by
Amani Investment Inc and Mahmoud
Purchase Details
Closed on
Aug 18, 2021
Sold by
Anaya Joe B and Vera Anaya Maribel
Bought by
Anaya Joe B and Vera Anay Maribel
Purchase Details
Closed on
Mar 7, 2002
Sold by
Chang Stephen and Chang Margaret
Bought by
Anaya Joe B and Vera Anaya Maribel
Home Financials for this Owner
Home Financials are based on the most recent Mortgage that was taken out on this home.
Original Mortgage
$140,800
Interest Rate
6.94%
Mortgage Type
Seller Take Back
Create a Home Valuation Report for This Property
The Home Valuation Report is an in-depth analysis detailing your home's value as well as a comparison with similar homes in the area
Home Values in the Area
Average Home Value in this Area
Purchase History
| Date | Buyer | Sale Price | Title Company |
|---|---|---|---|
| Morales Frisly Roel Diaz | $1,075,000 | Fidelity National Title Compan | |
| Amani Investment Inc | $850,000 | Fidelity National Title | |
| Anaya Joe B | -- | None Available | |
| Anaya Joe B | $176,000 | Financial Title Company | |
| Chang Stephen | -- | Financial Title Company |
Source: Public Records
Mortgage History
| Date | Status | Borrower | Loan Amount |
|---|---|---|---|
| Open | Morales Frisly Roel Diaz | $915,000 | |
| Previous Owner | Anaya Joe B | $140,800 |
Source: Public Records
Tax History Compared to Growth
Tax History
| Year | Tax Paid | Tax Assessment Tax Assessment Total Assessment is a certain percentage of the fair market value that is determined by local assessors to be the total taxable value of land and additions on the property. | Land | Improvement |
|---|---|---|---|---|
| 2025 | $10,939 | $1,025,000 | $130,000 | $895,000 |
| 2023 | $4,621 | $276,066 | $49,685 | $226,381 |
| 2022 | $4,521 | $268,787 | $48,711 | $220,076 |
| 2021 | $4,478 | $266,364 | $47,756 | $218,608 |
| 2020 | $4,437 | $261,522 | $47,267 | $214,255 |
| 2019 | $4,343 | $259,242 | $46,341 | $212,901 |
| 2018 | $4,279 | $254,673 | $45,433 | $209,240 |
| 2017 | $4,230 | $250,194 | $44,543 | $205,651 |
| 2016 | $4,106 | $245,802 | $43,670 | $202,132 |
| 2015 | $4,035 | $240,125 | $43,015 | $197,110 |
| 2014 | $3,940 | $238,489 | $42,173 | $196,316 |
Source: Public Records
Map
Nearby Homes
- 0 Tulare St
- 716 Mariposa St
- 564 F St
- 2890 Huntington Blvd Unit 141
- 2890 Huntington Blvd Unit 145
- 916 C St
- 0 C St
- 2881 E Huntington Blvd Unit 153
- 1128 Kern St
- 2881 Huntington Blvd Unit 121
- 2881 Huntington Blvd Unit 137
- 2909 Huntington Blvd Unit 229
- 2909 Huntington Blvd Unit 207
- 2909 Huntington Blvd Unit 133
- 2909 Huntington Blvd Unit 145
- 162 E St
- 1021 Mariposa St
- 3044 E Cesar Chavez Blvd
- 5064 A N Wishon
- 209 N Diana St
- 860 Fulton St Unit H7
- 820 Van Ness Ave
- 2039 Kern St
- 2027 Kern St
- 2127 Inyo St
- 915 Van Ness Ave
- 755 Van Ness Ave
- 902 Fulton Mall
- 2120 Kern St
- 922 Van Ness Ave
- 922 Van Ness Ave
- 2125 Kern St
- 901 L St Unit 2125 K
- 901 L St
- 2125 Kern St
- 727 Van Ness Ave
- 944 Fulton Mall
- 717 Van Ness Ave
- 921 Fulton St
- 727 Fulton St