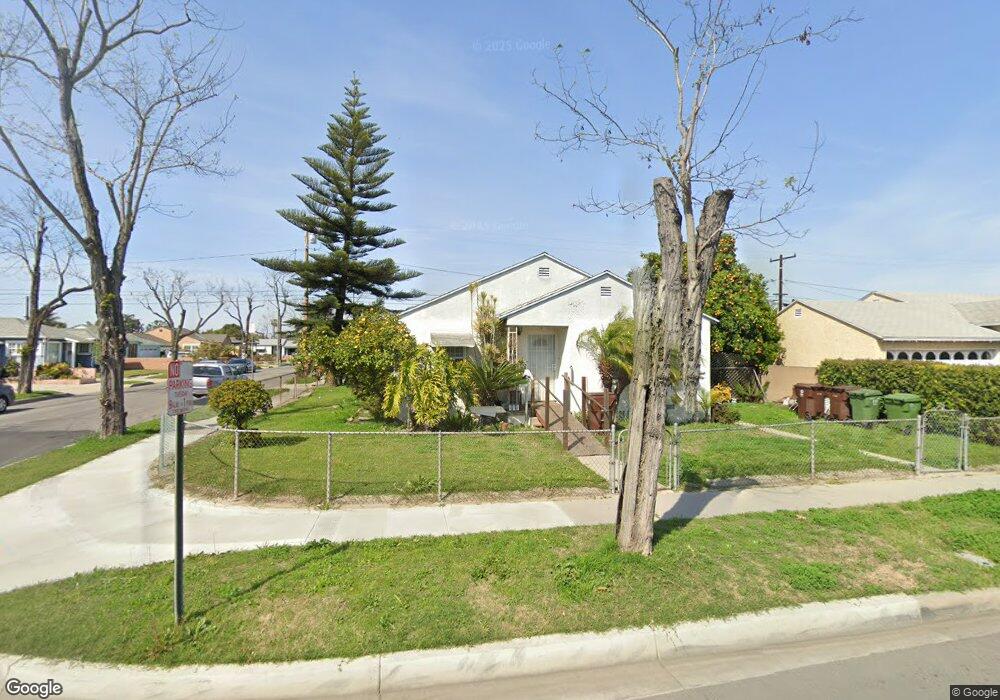
831 W 136th St Compton, CA 90222
Estimated Value: $588,000 - $651,000
3
Beds
2
Baths
1,282
Sq Ft
$487/Sq Ft
Est. Value
About This Home
This home is located at 831 W 136th St, Compton, CA 90222 and is currently estimated at $623,714, approximately $486 per square foot. 831 W 136th St is a home located in Los Angeles County with nearby schools including Washington Elementary School, Benjamin O. Davis Middle School, and Centennial High School.
Ownership History
Date
Name
Owned For
Owner Type
Purchase Details
Closed on
Mar 22, 2004
Sold by
Heads Charne and Heads Thomas Benjamin
Bought by
Heads Charne
Current Estimated Value
Home Financials for this Owner
Home Financials are based on the most recent Mortgage that was taken out on this home.
Original Mortgage
$135,765
Outstanding Balance
$71,651
Interest Rate
7.55%
Mortgage Type
New Conventional
Estimated Equity
$552,063
Purchase Details
Closed on
Mar 8, 1996
Sold by
Heads Charlotte L
Bought by
Heads Charne
Home Financials for this Owner
Home Financials are based on the most recent Mortgage that was taken out on this home.
Original Mortgage
$119,428
Interest Rate
8.3%
Mortgage Type
FHA
Purchase Details
Closed on
Feb 26, 1996
Sold by
Knight Henry and Knight Mildred D
Bought by
Heads Charne and Heads Thomas Benjamin
Home Financials for this Owner
Home Financials are based on the most recent Mortgage that was taken out on this home.
Original Mortgage
$119,428
Interest Rate
8.3%
Mortgage Type
FHA
Create a Home Valuation Report for This Property
The Home Valuation Report is an in-depth analysis detailing your home's value as well as a comparison with similar homes in the area
Home Values in the Area
Average Home Value in this Area
Purchase History
| Date | Buyer | Sale Price | Title Company |
|---|---|---|---|
| Heads Charne | -- | Chicago Title | |
| Heads Charne | -- | North American Title Co | |
| Heads Charne | $120,000 | North American Title Co |
Source: Public Records
Mortgage History
| Date | Status | Borrower | Loan Amount |
|---|---|---|---|
| Open | Heads Charne | $135,765 | |
| Previous Owner | Heads Charne | $119,428 |
Source: Public Records
Tax History
| Year | Tax Paid | Tax Assessment Tax Assessment Total Assessment is a certain percentage of the fair market value that is determined by local assessors to be the total taxable value of land and additions on the property. | Land | Improvement |
|---|---|---|---|---|
| 2025 | $4,820 | $251,242 | $144,297 | $106,945 |
| 2024 | $4,820 | $246,317 | $141,468 | $104,849 |
| 2023 | $4,756 | $241,489 | $138,695 | $102,794 |
| 2022 | $4,496 | $236,755 | $135,976 | $100,779 |
| 2021 | $4,209 | $232,113 | $133,310 | $98,803 |
| 2019 | $4,380 | $225,230 | $129,357 | $95,873 |
| 2018 | $4,218 | $220,815 | $126,821 | $93,994 |
| 2016 | $3,990 | $212,243 | $121,898 | $90,345 |
| 2015 | $3,821 | $209,055 | $120,067 | $88,988 |
| 2014 | $3,754 | $204,961 | $117,716 | $87,245 |
Source: Public Records
Map
Nearby Homes
- 1716 N Grandee Ave
- 910 W 138th St
- 0 W 134th Place
- 1036 W Stockwell St
- 720 W 137th St
- 1608 N Grape Ave
- 850 W 132nd St
- 1808 N Grape Ave
- 701 W 139th St
- 1201 W 138th St
- 2207 N Anzac Ave
- 1209 W 136th St
- 810 W 133rd St
- 720 W Cherry St
- 9607 S Evers Ave
- 629 W Plum St
- 2062 E Hatchway St
- 806 W Spruce St
- 1406 W Stockwell St
- 1410 W Stockwell St
- 827 W 136th St
- 1708 N Holmes Ave
- 903 W 136th St
- 823 W 136th St
- 1712 N Holmes Ave
- 1709 N Holmes Ave
- 836 W 136th St
- 1709 N Bandera Ave
- 832 W 136th St
- 907 W 136th St
- 819 W 136th St
- 900 W 136th St
- 1716 N Holmes Ave
- 828 W 136th St
- 1713 N Holmes Ave
- 1713 N Bandera Ave
- 904 W 136th St
- 824 W 136th St
- 1717 N Holmes Ave
- 911 W 136th St
Your Personal Tour Guide
Ask me questions while you tour the home.