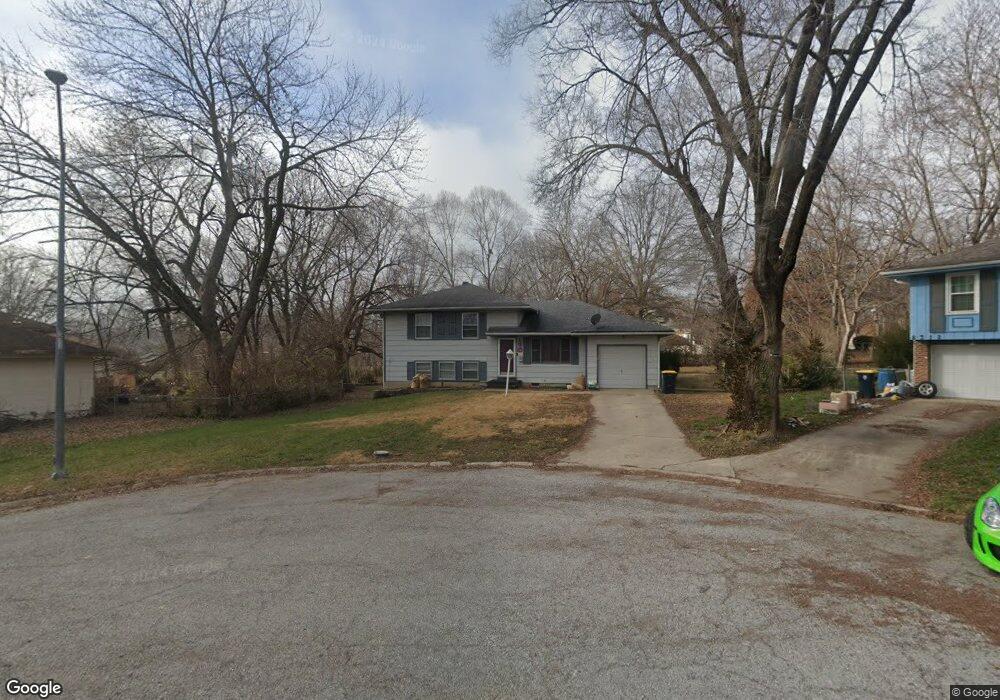
8310 E 91st St Kansas City, MO 64138
Fairwood & Robandee NeighborhoodEstimated Value: $165,000 - $185,000
3
Beds
2
Baths
888
Sq Ft
$193/Sq Ft
Est. Value
About This Home
This home is located at 8310 E 91st St, Kansas City, MO 64138 and is currently estimated at $171,779, approximately $193 per square foot. 8310 E 91st St is a home located in Jackson County with nearby schools including Dobbs Elementary School, St Regis School, and Islamic School of Greater Kansas City.
Ownership History
Date
Name
Owned For
Owner Type
Purchase Details
Closed on
Dec 20, 2004
Sold by
Palmer Anthony B and Palmer Amanda E
Bought by
Blaise David I
Current Estimated Value
Home Financials for this Owner
Home Financials are based on the most recent Mortgage that was taken out on this home.
Original Mortgage
$74,000
Outstanding Balance
$39,474
Interest Rate
6.72%
Mortgage Type
New Conventional
Estimated Equity
$132,305
Purchase Details
Closed on
Feb 26, 1997
Sold by
Helm Kelly M
Bought by
Palmer Anthony B and Palmer Amanda E
Home Financials for this Owner
Home Financials are based on the most recent Mortgage that was taken out on this home.
Original Mortgage
$64,264
Interest Rate
7.92%
Mortgage Type
FHA
Purchase Details
Closed on
Sep 11, 1996
Sold by
Beneficial Mtg Co Of Kansas Inc
Bought by
8310 East 91St Street Trust
Purchase Details
Closed on
May 28, 1996
Sold by
Hannah Susan C
Bought by
Beneficial Mtg Co Of Kansas Inc
Create a Home Valuation Report for This Property
The Home Valuation Report is an in-depth analysis detailing your home's value as well as a comparison with similar homes in the area
Home Values in the Area
Average Home Value in this Area
Purchase History
| Date | Buyer | Sale Price | Title Company |
|---|---|---|---|
| Blaise David I | -- | Kansas City Title | |
| Palmer Anthony B | -- | Ati Title Company | |
| 8310 East 91St Street Trust | -- | Nations Title Agency Inc | |
| Beneficial Mtg Co Of Kansas Inc | $39,500 | -- |
Source: Public Records
Mortgage History
| Date | Status | Borrower | Loan Amount |
|---|---|---|---|
| Open | Blaise David I | $74,000 | |
| Previous Owner | Palmer Anthony B | $64,264 |
Source: Public Records
Tax History Compared to Growth
Tax History
| Year | Tax Paid | Tax Assessment Tax Assessment Total Assessment is a certain percentage of the fair market value that is determined by local assessors to be the total taxable value of land and additions on the property. | Land | Improvement |
|---|---|---|---|---|
| 2025 | $1,925 | $17,338 | $2,662 | $14,676 |
| 2024 | $1,890 | $22,236 | $2,383 | $19,853 |
| 2023 | $1,890 | $22,236 | $1,940 | $20,296 |
| 2022 | $1,298 | $13,110 | $3,287 | $9,823 |
| 2021 | $1,120 | $13,110 | $3,287 | $9,823 |
| 2020 | $1,184 | $13,106 | $3,287 | $9,819 |
| 2019 | $1,120 | $13,106 | $3,287 | $9,819 |
| 2018 | $836 | $9,138 | $1,828 | $7,310 |
| 2017 | $836 | $9,138 | $1,828 | $7,310 |
| 2016 | $749 | $7,946 | $2,643 | $5,303 |
| 2014 | $726 | $7,790 | $2,591 | $5,199 |
Source: Public Records
Map
Nearby Homes
- 9203 Marsh Ave
- 8003 E 91st Terrace
- 7800 E 91st St
- 8416 E 92nd Place
- 7722 E 90th Terrace
- 7718 E 90th Terrace
- 9211 Manchester Ave
- 8818 James A Reed Rd
- 8902 Manchester Ave
- 7701 E 90th Terrace
- 9218 Mckinley St
- 8803 Manchester Ave
- 8021 E 88th St
- 7413 Loma Vista Dr
- 7800 E 87th Terrace
- 7901 E 87th St
- 9227 Eastern Ave
- 9414 Lewis Ave
- 7809 E 87th St
- 9525 Wallace Ave
- 8312 E 91st St
- 8308 E 91st St
- 8314 E 91st St
- 8316 E 91st St
- 8318 E 91st St
- 8306 E 91st St
- 9029 James A Reed Rd
- 9027 James A Reed Rd
- 9031 James A Reed Rd
- 8304 E 91st St
- 8315 E 91st St
- 9033 James A Reed Rd
- 8309 E 91st St
- 8320 E 91st St
- 8302 E 91st St
- 9101 James A Reed Rd
- 8305 E 91st St
- 9030 James A Reed Rd
- 8319 E 91st St
- 8400 E 91st St