Estimated Value: $430,017 - $561,000
3
Beds
1
Bath
925
Sq Ft
$533/Sq Ft
Est. Value
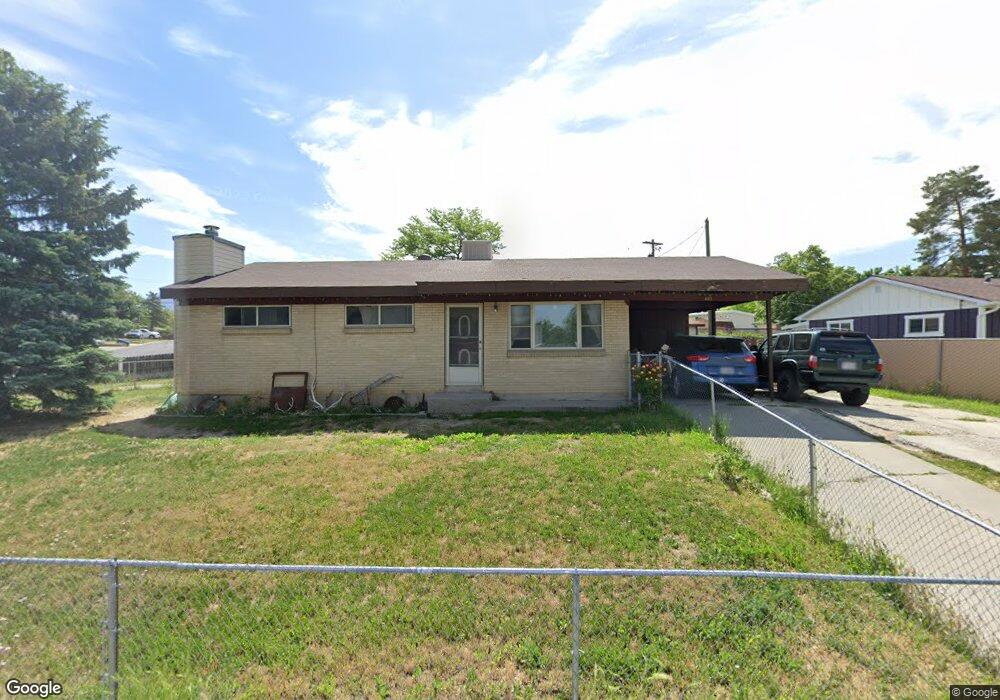
About This Home
This home is located at 8311 Bryce Dr, Sandy, UT 84070 and is currently estimated at $493,004, approximately $532 per square foot. 8311 Bryce Dr is a home located in Salt Lake County with nearby schools including Midvalley Elementary School, Union Middle School, and Hillcrest High School.
Ownership History
Date
Name
Owned For
Owner Type
Purchase Details
Closed on
Oct 9, 2018
Sold by
Hartle Mary Louise
Bought by
Hartle Daniel
Current Estimated Value
Purchase Details
Closed on
Aug 22, 2018
Sold by
Hartle Mary Louise
Bought by
Hartle Mary Louise and Hartle Daniel
Purchase Details
Closed on
Dec 5, 1997
Sold by
Hartle Tru Lamont and Hartle Mary Louise
Bought by
Hartle Tru Lamont and Hartle Mary Louise
Home Financials for this Owner
Home Financials are based on the most recent Mortgage that was taken out on this home.
Original Mortgage
$85,840
Outstanding Balance
$14,471
Interest Rate
7.19%
Estimated Equity
$478,533
Create a Home Valuation Report for This Property
The Home Valuation Report is an in-depth analysis detailing your home's value as well as a comparison with similar homes in the area
Home Values in the Area
Average Home Value in this Area
Purchase History
| Date | Buyer | Sale Price | Title Company |
|---|---|---|---|
| Hartle Daniel | -- | Accommodation | |
| Hartle Mary Louise | -- | South Valley Title Ins | |
| Hartle Tru Lamont | -- | -- | |
| Hartle Tru Lamont | -- | -- |
Source: Public Records
Mortgage History
| Date | Status | Borrower | Loan Amount |
|---|---|---|---|
| Open | Hartle Tru Lamont | $85,840 |
Source: Public Records
Tax History
| Year | Tax Paid | Tax Assessment Tax Assessment Total Assessment is a certain percentage of the fair market value that is determined by local assessors to be the total taxable value of land and additions on the property. | Land | Improvement |
|---|---|---|---|---|
| 2025 | $2,457 | $437,100 | $126,000 | $311,100 |
| 2024 | $2,457 | $430,300 | $118,500 | $311,800 |
| 2023 | $2,149 | $372,400 | $112,600 | $259,800 |
| 2022 | $2,180 | $382,700 | $110,400 | $272,300 |
| 2021 | $1,913 | $292,800 | $96,000 | $196,800 |
| 2020 | $1,822 | $263,100 | $77,800 | $185,300 |
| 2019 | $1,830 | $249,600 | $77,800 | $171,800 |
| 2016 | $1,877 | $197,100 | $69,100 | $128,000 |
Source: Public Records
Map
Nearby Homes
- 359 E 8400 S
- 8459 S 300 E
- 8322 S Levine Ln Unit 111
- 8260 S 560 E
- 227 E St Germain Way
- 274 E Water Mill Way Unit 230
- 257 Water Mill Way Unit 211
- 257 E Water Mill Way
- 144 E Chambord Ct
- 140 E Chambord Ct
- 138 E Chambord Ct
- 136 E Chambord Ct
- 132 E Chambord Ct
- 194 Pioneer Ave
- 220 E Pioneer Ave
- 8278 S Resaca Dr Unit L1
- 8264 S Resaca Dr Unit K9
- 149 E Pioneer Ave
- 8087 S 615 E
- 117 E Calbourne Ln Unit I4
Your Personal Tour Guide
Ask me questions while you tour the home.