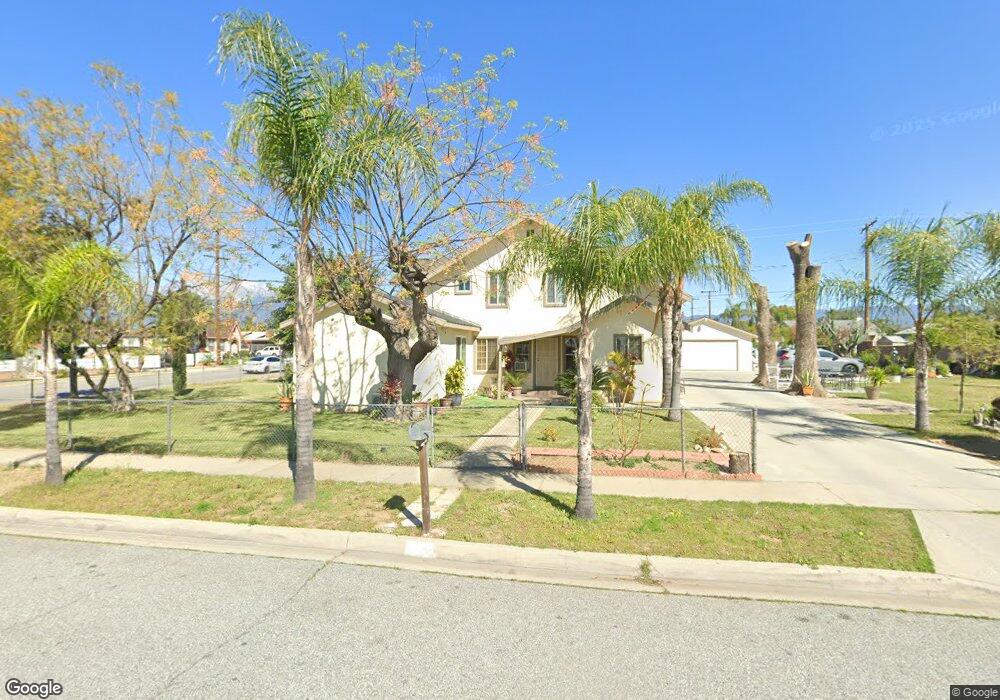
8311 Oleander Ave Fontana, CA 92335
Estimated Value: $729,395 - $1,024,000
5
Beds
2
Baths
2,431
Sq Ft
$346/Sq Ft
Est. Value
About This Home
This home is located at 8311 Oleander Ave, Fontana, CA 92335 and is currently estimated at $840,349, approximately $345 per square foot. 8311 Oleander Ave is a home located in San Bernardino County with nearby schools including Oleander Elementary School, Fontana Middle School, and Fontana High School.
Ownership History
Date
Name
Owned For
Owner Type
Purchase Details
Closed on
May 22, 2013
Sold by
Lepe Pablo
Bought by
Lepe Pablo and Lepe Antolina
Current Estimated Value
Home Financials for this Owner
Home Financials are based on the most recent Mortgage that was taken out on this home.
Original Mortgage
$183,100
Outstanding Balance
$132,050
Interest Rate
3.88%
Mortgage Type
New Conventional
Estimated Equity
$708,299
Purchase Details
Closed on
Jun 28, 2006
Sold by
Lepe Pablo
Bought by
Lepe Pablo and Lepe Antolina
Home Financials for this Owner
Home Financials are based on the most recent Mortgage that was taken out on this home.
Original Mortgage
$195,550
Interest Rate
6.63%
Mortgage Type
New Conventional
Purchase Details
Closed on
May 3, 1998
Sold by
Lepe Pablo and Lepe Ascencion
Bought by
Lepe Pablo and Lepe Antolina
Create a Home Valuation Report for This Property
The Home Valuation Report is an in-depth analysis detailing your home's value as well as a comparison with similar homes in the area
Home Values in the Area
Average Home Value in this Area
Purchase History
| Date | Buyer | Sale Price | Title Company |
|---|---|---|---|
| Lepe Pablo | -- | First American Title Company | |
| Martinez Paola | -- | First American Title Company | |
| Lepe Pablo | -- | Ticor Title Company | |
| Lepe Pablo | -- | -- |
Source: Public Records
Mortgage History
| Date | Status | Borrower | Loan Amount |
|---|---|---|---|
| Open | Lepe Pablo | $183,100 | |
| Closed | Lepe Pablo | $195,550 |
Source: Public Records
Tax History Compared to Growth
Tax History
| Year | Tax Paid | Tax Assessment Tax Assessment Total Assessment is a certain percentage of the fair market value that is determined by local assessors to be the total taxable value of land and additions on the property. | Land | Improvement |
|---|---|---|---|---|
| 2025 | $5,205 | $449,902 | $88,420 | $361,482 |
| 2024 | $5,205 | $441,080 | $86,686 | $354,394 |
| 2023 | $2,661 | $252,431 | $84,986 | $167,445 |
| 2022 | $2,576 | $247,482 | $83,320 | $164,162 |
| 2021 | $2,542 | $242,629 | $81,686 | $160,943 |
| 2020 | $2,462 | $233,341 | $80,848 | $152,493 |
| 2019 | $2,278 | $218,761 | $79,263 | $139,498 |
| 2018 | $2,312 | $214,472 | $77,709 | $136,763 |
| 2017 | $2,297 | $210,266 | $76,185 | $134,081 |
| 2016 | $2,257 | $206,143 | $74,691 | $131,452 |
| 2015 | $2,227 | $203,046 | $73,569 | $129,477 |
| 2014 | $2,227 | $199,069 | $72,128 | $126,941 |
Source: Public Records
Map
Nearby Homes
- 16250 Upland Ave
- 8164 Cypress Ave
- 16304 Foothill Blvd
- 16203 Foothill Blvd
- 16436 Foothill Blvd
- 8147 Cypress Ave
- 8238 Pepper Ave
- 16590 Terrace Ln Unit G
- 8566 Cypress Ave
- 8621 Cypress Ave
- 8636 Cypress Ave
- 7938 Chantry Ave
- 16554 Reed St
- 7801 Pinyon Ave
- 16158 Ceres Ave
- 7908 Tokay Ave Unit 108
- 8788 Citrus Ave
- 15797 Foothill Blvd
- 0 Foothill Blvd Unit CV25217423
- 0 Sierra Ave Unit EV22072866
- 16319 Upland Ave
- 16309 Upland Ave
- 16342 Owen St
- 16317 Owen St
- 16331 Upland Ave
- 8310 Oleander Ave
- 16327 Owen St
- 16339 Upland Ave
- 8294 Oleander Ave
- 8322 Oleander Ave
- 16352 Owen St
- 16335 Owen St
- 8353 Oleander Ave
- 16289 Upland Ave
- 16349 Upland Ave
- 16343 Owen St
- 16362 Owen St
- 8265 Oleander Ave
- 8348 Oleander Ave
- 16357 Upland Ave