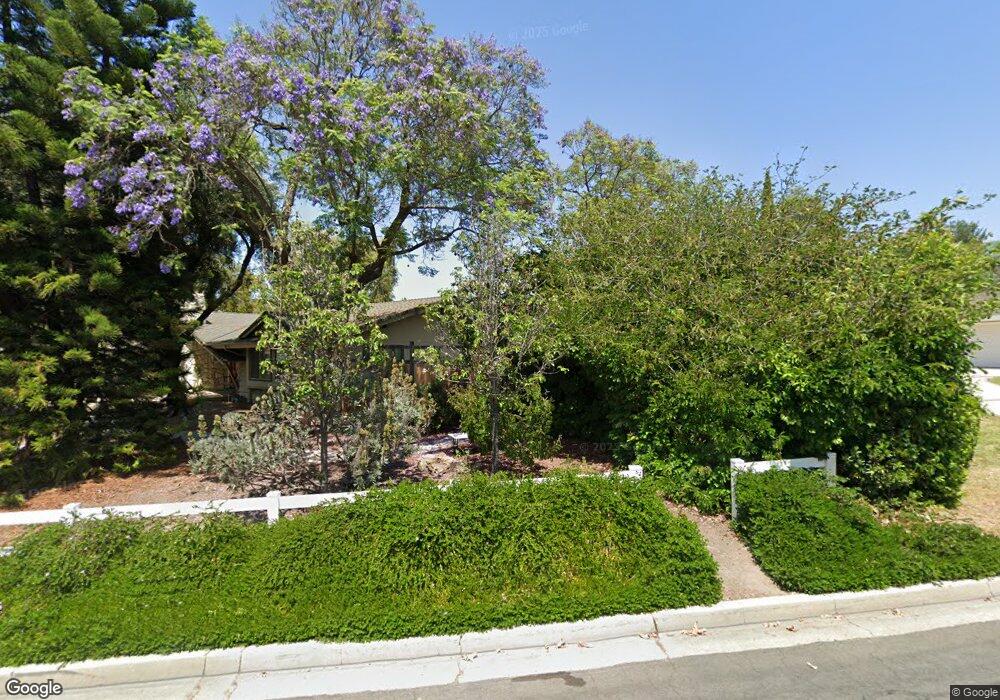
8312 Ridglea Ave Buena Park, CA 90621
Estimated Value: $1,219,000 - $1,365,000
4
Beds
3
Baths
2,576
Sq Ft
$502/Sq Ft
Est. Value
About This Home
This home is located at 8312 Ridglea Ave, Buena Park, CA 90621 and is currently estimated at $1,292,445, approximately $501 per square foot. 8312 Ridglea Ave is a home located in Orange County with nearby schools including Gordon H. Beatty Elementary School, Buena Park Junior High School, and Sunny Hills High School.
Ownership History
Date
Name
Owned For
Owner Type
Purchase Details
Closed on
Nov 21, 2016
Sold by
Chen Diana Yun Ping and Chen Diana Yun Ping
Bought by
Chen Diana Yun Ping and The Diana Yun Ping Chen Revocable Living
Current Estimated Value
Purchase Details
Closed on
Jul 12, 2016
Sold by
Chen John Jerry and Chen Cynthia Joanne
Bought by
Chen Diana Yun Ping
Purchase Details
Closed on
Aug 12, 2011
Sold by
Chen Diana Yun Ping
Bought by
Chen Diana Yun Ping and Chen John Jerry
Purchase Details
Closed on
Jan 31, 2011
Sold by
Chen David Hsein Pin
Bought by
Chen Diana Yun Ping
Purchase Details
Closed on
Feb 18, 1997
Sold by
Ramirez Javier B and Ramirez Martha V
Bought by
Chen David Hsein Pin and Chen Diana Yun Ping
Home Financials for this Owner
Home Financials are based on the most recent Mortgage that was taken out on this home.
Original Mortgage
$214,600
Interest Rate
7.56%
Create a Home Valuation Report for This Property
The Home Valuation Report is an in-depth analysis detailing your home's value as well as a comparison with similar homes in the area
Home Values in the Area
Average Home Value in this Area
Purchase History
| Date | Buyer | Sale Price | Title Company |
|---|---|---|---|
| Chen Diana Yun Ping | -- | None Available | |
| Chen Diana Yun Ping | -- | None Available | |
| Chen Diana Yun Ping | -- | Accommodation | |
| Chen Diana Yun Ping | -- | None Available | |
| Chen David Hsein Pin | $288,000 | Fidelity National Title Ins |
Source: Public Records
Mortgage History
| Date | Status | Borrower | Loan Amount |
|---|---|---|---|
| Previous Owner | Chen David Hsein Pin | $214,600 |
Source: Public Records
Tax History Compared to Growth
Tax History
| Year | Tax Paid | Tax Assessment Tax Assessment Total Assessment is a certain percentage of the fair market value that is determined by local assessors to be the total taxable value of land and additions on the property. | Land | Improvement |
|---|---|---|---|---|
| 2025 | $5,286 | $469,056 | $311,167 | $157,889 |
| 2024 | $5,286 | $459,859 | $305,065 | $154,794 |
| 2023 | $5,177 | $450,843 | $299,084 | $151,759 |
| 2022 | $5,092 | $442,003 | $293,219 | $148,784 |
| 2021 | $5,054 | $433,337 | $287,470 | $145,867 |
| 2020 | $4,991 | $428,894 | $284,522 | $144,372 |
| 2019 | $4,871 | $420,485 | $278,943 | $141,542 |
| 2018 | $4,776 | $412,241 | $273,474 | $138,767 |
| 2017 | $4,708 | $404,158 | $268,111 | $136,047 |
| 2016 | $4,613 | $396,234 | $262,854 | $133,380 |
| 2015 | $4,413 | $390,283 | $258,906 | $131,377 |
| 2014 | $4,397 | $382,638 | $253,834 | $128,804 |
Source: Public Records
Map
Nearby Homes
- 4900 Lincolnshire Ave
- 4738 Durango Dr
- 8244 Henderson Green
- 5211 Fox Hills Ave
- 14806 Faceta Dr
- 2150 Cheyenne Way Unit 169
- 14724 Mercado Ave
- 2200 Cheyenne Way Unit 117
- 14828 Rayfield Dr
- 5412 Arrowhead Ave
- 8237 Henshaw Cir
- 15213 Santa Gertrudes Ave Unit W106
- 15233 Santa Gertrudes Ave
- 8542 Emerywood Dr
- 5471 Jonesboro Way
- 15220 Ocaso Ave Unit H103
- 15224 Ocaso Ave Unit H212
- 15819 Rosalita Dr
- 15011 La Mesa Dr
- 14727 La Mesa Dr
- 8332 Ridglea Ave
- 4870 Saint Andrews Ave
- 4850 Saint Andrews Ave
- 4880 Saint Andrews Ave
- 4902 Saint Andrews Cir
- 8342 Ridglea Ave
- 4890 Saint Andrews Ave
- 8301 Ridglea Ave
- 8321 Ridglea Ave
- 4904 Saint Andrews Cir
- 4861 Saint Andrews Ave
- 4900 Saint Andrews Ave
- 8351 Ridglea Ave
- 4841 Saint Andrews Ave
- 4800 Saint Andrews Ave
- 8362 Ridglea Ave
- 4906 Saint Andrews Cir
- 4882 Ridglea Ave
- 4900 Somerset St
- 4901 Somerset St