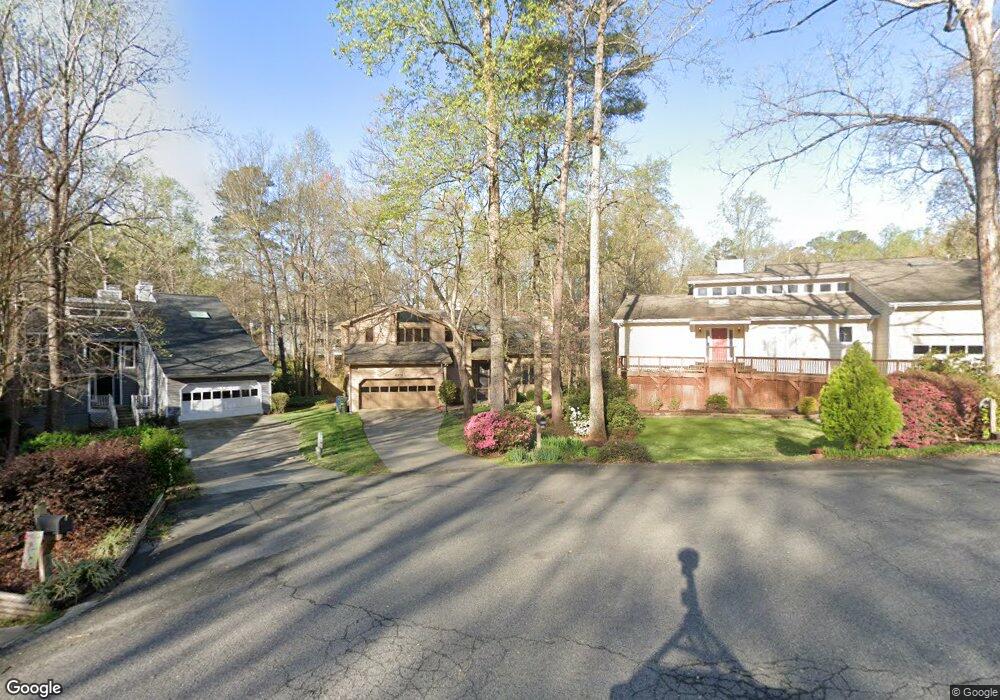
8313 Stryker Ct Raleigh, NC 27615
Six Forks NeighborhoodEstimated Value: $649,000 - $688,000
4
Beds
3
Baths
2,520
Sq Ft
$265/Sq Ft
Est. Value
About This Home
This home is located at 8313 Stryker Ct, Raleigh, NC 27615 and is currently estimated at $667,910, approximately $265 per square foot. 8313 Stryker Ct is a home located in Wake County with nearby schools including North Ridge Elementary School, West Millbrook Middle School, and Sanderson High School.
Ownership History
Date
Name
Owned For
Owner Type
Purchase Details
Closed on
Mar 18, 2009
Sold by
Yates Marshall William and Yates Meredith Mark
Bought by
Nunalee Frank Nelson and Nunalee Michelle L
Current Estimated Value
Home Financials for this Owner
Home Financials are based on the most recent Mortgage that was taken out on this home.
Original Mortgage
$262,569
Interest Rate
4.77%
Mortgage Type
New Conventional
Purchase Details
Closed on
Apr 30, 2007
Sold by
Jameson Charles W and Jameson Barbara L
Bought by
Yates Marshall William and Yates Meredith Mark
Home Financials for this Owner
Home Financials are based on the most recent Mortgage that was taken out on this home.
Original Mortgage
$43,125
Interest Rate
5.84%
Mortgage Type
Stand Alone Second
Create a Home Valuation Report for This Property
The Home Valuation Report is an in-depth analysis detailing your home's value as well as a comparison with similar homes in the area
Home Values in the Area
Average Home Value in this Area
Purchase History
| Date | Buyer | Sale Price | Title Company |
|---|---|---|---|
| Nunalee Frank Nelson | $288,000 | None Available | |
| Yates Marshall William | $287,500 | None Available |
Source: Public Records
Mortgage History
| Date | Status | Borrower | Loan Amount |
|---|---|---|---|
| Previous Owner | Nunalee Frank Nelson | $262,569 | |
| Previous Owner | Yates Marshall William | $43,125 | |
| Previous Owner | Yates Marshall William | $230,000 |
Source: Public Records
Tax History Compared to Growth
Tax History
| Year | Tax Paid | Tax Assessment Tax Assessment Total Assessment is a certain percentage of the fair market value that is determined by local assessors to be the total taxable value of land and additions on the property. | Land | Improvement |
|---|---|---|---|---|
| 2025 | $5,106 | $583,208 | $170,000 | $413,208 |
| 2024 | $5,085 | $583,208 | $170,000 | $413,208 |
| 2023 | $3,663 | $334,206 | $120,000 | $214,206 |
| 2022 | $3,404 | $334,206 | $120,000 | $214,206 |
| 2021 | $3,272 | $334,206 | $120,000 | $214,206 |
| 2020 | $3,320 | $345,480 | $120,000 | $225,480 |
| 2019 | $3,504 | $300,630 | $120,000 | $180,630 |
| 2018 | $3,305 | $300,630 | $120,000 | $180,630 |
| 2017 | $3,147 | $300,630 | $120,000 | $180,630 |
| 2016 | $3,083 | $300,630 | $120,000 | $180,630 |
| 2015 | $3,068 | $294,356 | $110,000 | $184,356 |
| 2014 | $2,910 | $294,356 | $110,000 | $184,356 |
Source: Public Records
Map
Nearby Homes
- 8325 Stryker Ct
- 8305 Society Place
- 110 Bon Marche Ln
- 206 Nouveau Ave
- 42 Renwick Ct
- 7731 Kingsberry Ct
- 206 Royal Kings Ln
- 7715 Kingsberry Ct
- 8304 Wycombe Ln
- 8039 Brandyapple Dr
- 8041 Allyns Landing Way Unit 101
- 8112 Running Cedar Trail
- 8011 Allyns Landing Way Unit 202
- 8231 Allyns Landing Way Unit 101
- 136 Yorkchester Way
- 309 Penn Oak Cir
- 7719 Kelley Ct Unit 314E
- 8004 Thrush Ridge Ln
- 7729 Bernadette Ln Unit 322B
- 727 Swan Neck Ln
- 8317 Stryker Ct
- 11677 Stryker Ct Unit 108
- 8401 Summersprings Ln
- 8305 Stryker Ct
- 8321 Stryker Ct
- 8400 Summersprings Ln
- 8321 Old Deer Trail
- 8317 Old Deer Trail
- 8405 Summersprings Ln
- 8313 Old Deer Trail
- 7900 Featherstone Dr
- 7800 Featherstone Dr
- 7800 Featherstone Dr Unit B
- 7800 Featherstone Dr Unit E
- 8325 Old Deer Trail
- 8404 Summersprings Ln
- 8409 Summersprings Ln
- 7904 Featherstone Dr
- 8309 Old Deer Trail
- 8408 Summersprings Ln