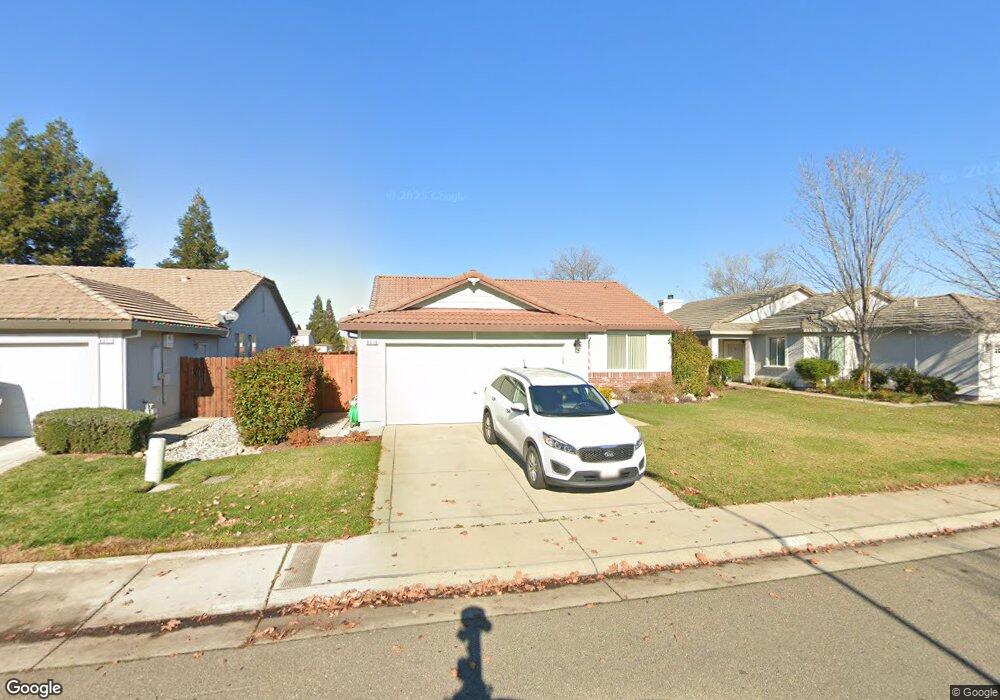
8315 Carriage Oaks Way Antelope, CA 95843
Estimated Value: $359,000 - $532,000
3
Beds
2
Baths
1,491
Sq Ft
$323/Sq Ft
Est. Value
About This Home
This home is located at 8315 Carriage Oaks Way, Antelope, CA 95843 and is currently estimated at $481,723, approximately $323 per square foot. 8315 Carriage Oaks Way is a home located in Sacramento County with nearby schools including Creekview Ranch and Antelope High School.
Ownership History
Date
Name
Owned For
Owner Type
Purchase Details
Closed on
Aug 6, 2024
Sold by
Neary Nancy
Bought by
Nancy E Neary Revocable Trust and Neary
Current Estimated Value
Purchase Details
Closed on
May 2, 2017
Sold by
Roberts Ava M
Bought by
Neary Nancy
Home Financials for this Owner
Home Financials are based on the most recent Mortgage that was taken out on this home.
Original Mortgage
$315,875
Interest Rate
4.23%
Mortgage Type
New Conventional
Purchase Details
Closed on
Jun 20, 2002
Sold by
U S Home Corp
Bought by
Roberts Ava M
Home Financials for this Owner
Home Financials are based on the most recent Mortgage that was taken out on this home.
Original Mortgage
$192,748
Interest Rate
6.86%
Mortgage Type
FHA
Create a Home Valuation Report for This Property
The Home Valuation Report is an in-depth analysis detailing your home's value as well as a comparison with similar homes in the area
Home Values in the Area
Average Home Value in this Area
Purchase History
| Date | Buyer | Sale Price | Title Company |
|---|---|---|---|
| Nancy E Neary Revocable Trust | -- | None Listed On Document | |
| Neary Nancy | $332,500 | Chicago Title Company | |
| Roberts Ava M | $196,000 | North American Title Co |
Source: Public Records
Mortgage History
| Date | Status | Borrower | Loan Amount |
|---|---|---|---|
| Previous Owner | Neary Nancy | $315,875 | |
| Previous Owner | Roberts Ava M | $192,748 |
Source: Public Records
Tax History Compared to Growth
Tax History
| Year | Tax Paid | Tax Assessment Tax Assessment Total Assessment is a certain percentage of the fair market value that is determined by local assessors to be the total taxable value of land and additions on the property. | Land | Improvement |
|---|---|---|---|---|
| 2025 | $4,155 | $385,889 | $92,843 | $293,046 |
| 2024 | $4,155 | $378,323 | $91,023 | $287,300 |
| 2023 | $4,922 | $370,906 | $89,239 | $281,667 |
| 2022 | $4,905 | $363,635 | $87,490 | $276,145 |
| 2021 | $4,905 | $356,506 | $85,775 | $270,731 |
| 2020 | $4,852 | $352,851 | $84,896 | $267,955 |
| 2019 | $4,775 | $345,933 | $83,232 | $262,701 |
| 2018 | $4,610 | $339,150 | $81,600 | $257,550 |
| 2017 | $3,524 | $249,314 | $76,366 | $172,948 |
| 2016 | $3,431 | $244,426 | $74,869 | $169,557 |
| 2015 | $3,362 | $240,756 | $73,745 | $167,011 |
| 2014 | $3,130 | $220,915 | $67,668 | $153,247 |
Source: Public Records
Map
Nearby Homes
- 8268 Ghislaine Way
- 0 Lewis Ave
- 9025 Palmerson Dr
- 8344 Coven Hills Place
- 9670 Canopy Tree St
- 3185 River Bank Ct
- 9620 Antelope Rd
- 8008 Landmark Place
- 4924 Meadow Pass Way
- 4923 Falconwood Ct
- 8038 Falcon View Dr
- 8568 Travary Way
- 3113 Jenna Ct
- 8011 Eagle Peak Way
- 7665 Copper Cove Place
- 7956 Brockwood Way
- 7929 Eagle Peak Way
- 6301 Autumn Oak Ct
- 7633 Wood Duck Ln Unit 67
- 6112 Ledgewood Way
- 8311 Carriage Oaks Way
- 8319 Carriage Oaks Way
- 8307 Carriage Oaks Way
- 8323 Carriage Oaks Way
- 8300 Ghislaine Way
- 8236 Gold Sierra Ct
- 8303 Carriage Oaks Way
- 8327 Carriage Oaks Way
- 8237 Madrone Woods Place
- 8308 Carriage Oaks Way
- 8232 Gold Sierra Ct
- 5616 Ridgepoint Dr
- 5612 Ridgepoint Dr
- 8304 Carriage Oaks Way
- 8233 Madrone Woods Place
- 8249 Carriage Oaks Way
- 8331 Carriage Oaks Way
- 8228 Gold Sierra Ct
- 8300 Carriage Oaks Way
- 8229 Madrone Woods Place