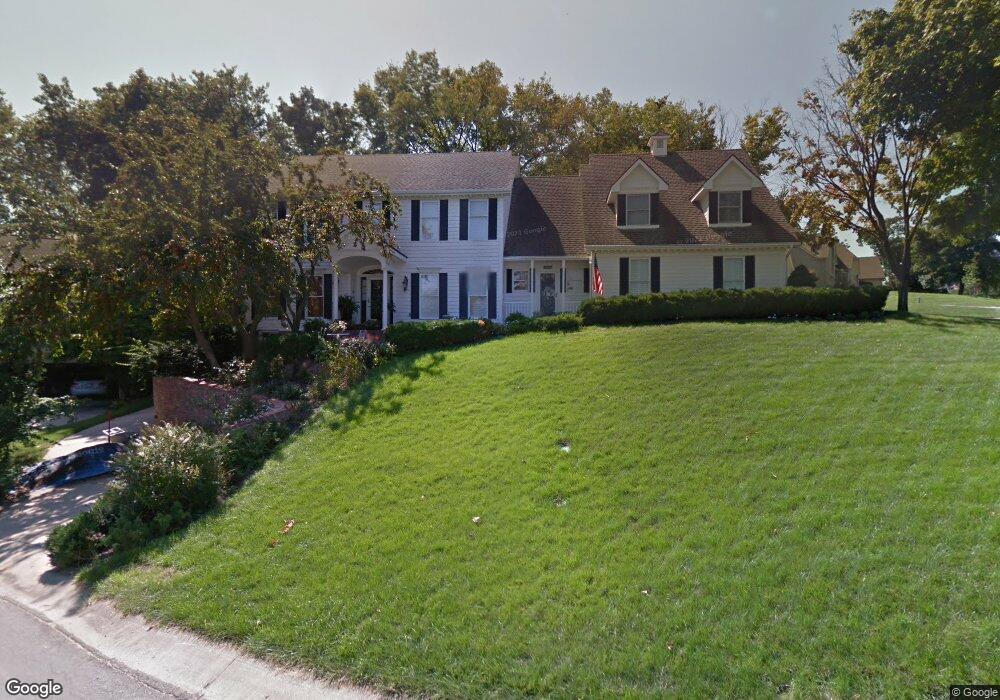
8315 Mullen Rd Lenexa, KS 66215
Estimated Value: $602,000 - $657,000
4
Beds
5
Baths
3,322
Sq Ft
$188/Sq Ft
Est. Value
About This Home
This home is located at 8315 Mullen Rd, Lenexa, KS 66215 and is currently estimated at $626,006, approximately $188 per square foot. 8315 Mullen Rd is a home located in Johnson County with nearby schools including Mill Creek Elementary School, Trailridge Middle School, and Shawnee Mission Northwest High School.
Ownership History
Date
Name
Owned For
Owner Type
Purchase Details
Closed on
Jun 25, 2012
Sold by
Hilgers Mary Ann
Bought by
Hilgers Mary Ann
Current Estimated Value
Home Financials for this Owner
Home Financials are based on the most recent Mortgage that was taken out on this home.
Original Mortgage
$240,000
Outstanding Balance
$163,714
Interest Rate
3.8%
Mortgage Type
New Conventional
Estimated Equity
$462,292
Purchase Details
Closed on
Aug 18, 2011
Sold by
Hilgers Greg and Hilgers Mary Ann
Bought by
Hilgers Mary Ann
Purchase Details
Closed on
Jan 28, 2005
Sold by
Amet Edward M and Amet Joan M
Bought by
Hilgers Greg and Hilgers Mary Ann
Create a Home Valuation Report for This Property
The Home Valuation Report is an in-depth analysis detailing your home's value as well as a comparison with similar homes in the area
Home Values in the Area
Average Home Value in this Area
Purchase History
| Date | Buyer | Sale Price | Title Company |
|---|---|---|---|
| Hilgers Mary Ann | -- | None Available | |
| Hilgers Mary Ann | -- | Homestead Title | |
| Hilgers Greg | -- | Multiple |
Source: Public Records
Mortgage History
| Date | Status | Borrower | Loan Amount |
|---|---|---|---|
| Open | Hilgers Mary Ann | $240,000 |
Source: Public Records
Tax History
| Year | Tax Paid | Tax Assessment Tax Assessment Total Assessment is a certain percentage of the fair market value that is determined by local assessors to be the total taxable value of land and additions on the property. | Land | Improvement |
|---|---|---|---|---|
| 2025 | $8,339 | $77,751 | $11,916 | $65,835 |
| 2024 | $8,339 | $74,991 | $10,366 | $64,625 |
| 2023 | $7,993 | $71,081 | $10,366 | $60,715 |
| 2022 | $7,542 | $67,045 | $9,015 | $58,030 |
| 2021 | $6,988 | $59,214 | $8,578 | $50,636 |
| 2020 | $6,726 | $56,431 | $8,578 | $47,853 |
| 2019 | $6,894 | $57,845 | $8,578 | $49,267 |
| 2018 | $6,796 | $56,523 | $8,578 | $47,945 |
| 2017 | $6,372 | $51,359 | $6,771 | $44,588 |
| 2016 | $6,324 | $50,347 | $6,771 | $43,576 |
| 2015 | $5,945 | $47,656 | $6,771 | $40,885 |
| 2013 | -- | $45,747 | $6,771 | $38,976 |
Source: Public Records
Map
Nearby Homes
- 8362 Oakview Cir
- 8041 Acuff Ln
- 8003 Mullen Rd
- 8221 Park St
- 13511 W 82nd St
- 8443 Alden St
- 8004 Constance St
- 7936 Alden St
- 14925 W 82nd Terrace
- 7908 Park St
- 8211 Caenen Lake Rd
- 14112 W 87th Terrace
- 13212 W 84th St
- 8403 Swarner Dr
- 8221 Noland Rd
- 8740 Park St
- 13204 W 85th Ct
- 13403 W 78th Place
- 8117 Woodstone St
- 7633 Acuff Ln
Your Personal Tour Guide
Ask me questions while you tour the home.