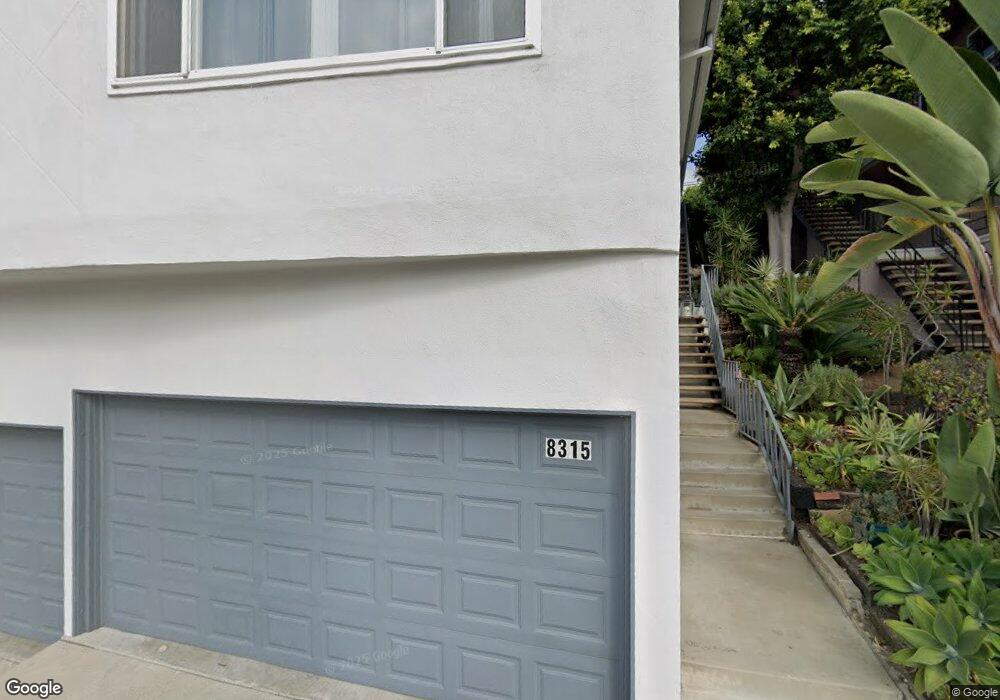
8315 W Manchester Ave Playa Del Rey, CA 90293
Estimated Value: $1,894,000 - $2,610,000
7
Beds
7
Baths
3,857
Sq Ft
$584/Sq Ft
Est. Value
About This Home
This home is located at 8315 W Manchester Ave, Playa Del Rey, CA 90293 and is currently estimated at $2,252,611, approximately $584 per square foot. 8315 W Manchester Ave is a home located in Los Angeles County with nearby schools including Paseo Del Rey Natural Science Magnet, Loyola Village Elementary School, and Kentwood Elementary.
Ownership History
Date
Name
Owned For
Owner Type
Purchase Details
Closed on
Jul 26, 2014
Sold by
Ashtiani Akram Sima
Bought by
Ashtiani Abbas
Current Estimated Value
Purchase Details
Closed on
Aug 31, 1999
Sold by
Hazen Larry E and Hazen Sharon M
Bought by
Ashtiani Abbas and Ashtiani Akram Sima
Home Financials for this Owner
Home Financials are based on the most recent Mortgage that was taken out on this home.
Original Mortgage
$397,500
Outstanding Balance
$118,478
Interest Rate
7.89%
Estimated Equity
$2,134,133
Purchase Details
Closed on
Sep 8, 1997
Sold by
Family Trust Hazen Larry E And Sharon M Trs H
Bought by
Hazen Larry E and Hazen Sharon M
Home Financials for this Owner
Home Financials are based on the most recent Mortgage that was taken out on this home.
Original Mortgage
$185,000
Interest Rate
6.99%
Purchase Details
Closed on
Oct 15, 1993
Sold by
Hazen Larry E and Hazen Sharon M
Bought by
Hazen Larry E and Hazen Sharon A
Create a Home Valuation Report for This Property
The Home Valuation Report is an in-depth analysis detailing your home's value as well as a comparison with similar homes in the area
Home Values in the Area
Average Home Value in this Area
Purchase History
| Date | Buyer | Sale Price | Title Company |
|---|---|---|---|
| Ashtiani Abbas | -- | None Available | |
| Ashtiani Abbas | $530,000 | First American Title Co | |
| Hazen Larry E | -- | First American | |
| Hazen Larry E | -- | -- |
Source: Public Records
Mortgage History
| Date | Status | Borrower | Loan Amount |
|---|---|---|---|
| Open | Ashtiani Abbas | $397,500 | |
| Previous Owner | Hazen Larry E | $185,000 |
Source: Public Records
Tax History Compared to Growth
Tax History
| Year | Tax Paid | Tax Assessment Tax Assessment Total Assessment is a certain percentage of the fair market value that is determined by local assessors to be the total taxable value of land and additions on the property. | Land | Improvement |
|---|---|---|---|---|
| 2025 | $10,203 | $814,577 | $568,671 | $245,906 |
| 2024 | $10,203 | $798,606 | $557,521 | $241,085 |
| 2023 | $10,017 | $782,948 | $546,590 | $236,358 |
| 2022 | $9,569 | $767,597 | $535,873 | $231,724 |
| 2021 | $9,434 | $752,547 | $525,366 | $227,181 |
| 2019 | $9,161 | $730,229 | $509,785 | $220,444 |
| 2018 | $9,057 | $715,912 | $499,790 | $216,122 |
| 2016 | $8,638 | $688,115 | $480,384 | $207,731 |
| 2015 | $8,516 | $677,780 | $473,169 | $204,611 |
| 2014 | $8,567 | $664,504 | $463,901 | $200,603 |
Source: Public Records
Map
Nearby Homes
- 8236 Delgany Ave
- 8238 W Manchester Ave Unit 108
- 8238 W Manchester Ave Unit 204
- 8701 Delgany Ave Unit 110
- 415 Campdell St
- 8710 Delgany Ave Unit 17
- 8710 Delgany Ave Unit 7
- 8710 Delgany Ave Unit 15
- 418 Talbert St
- 8512 Tuscany Ave Unit 207
- 8600 Tuscany Ave Unit 321
- 8600 Tuscany Ave Unit 301
- 8163 Redlands St Unit 24
- 8300 Manitoba St Unit 222
- 8346 Manitoba St Unit 11
- 7145 Trask Ave
- 8740 Tuscany Ave Unit 211
- 8740 Tuscany Ave Unit 109
- 7354 Trask Ave
- 8105 Redlands St Unit 107
- 8315 W Manchester Ave Unit 4
- 8311 W Manchester Ave
- 8321 W Manchester Ave
- 8325 W Manchester Ave Unit C
- 8325 W Manchester Ave Unit B
- 8325 W Manchester Ave
- 8375 Zitola Terrace
- 8331 W Manchester Ave Unit 4
- 8331 W Manchester Ave
- 8369 Zitola Terrace
- 8341 W Manchester Ave Unit 1
- 8341 W Manchester Ave Unit 2
- 8341 W Manchester Ave
- 8283 W Manchester Ave Unit 106
- 8324 W Manchester Ave
- 8250 W 83rd St
- 8363 Zitola Terrace
- 8306 Manchester Ave
- 8380 Zitola Terrace