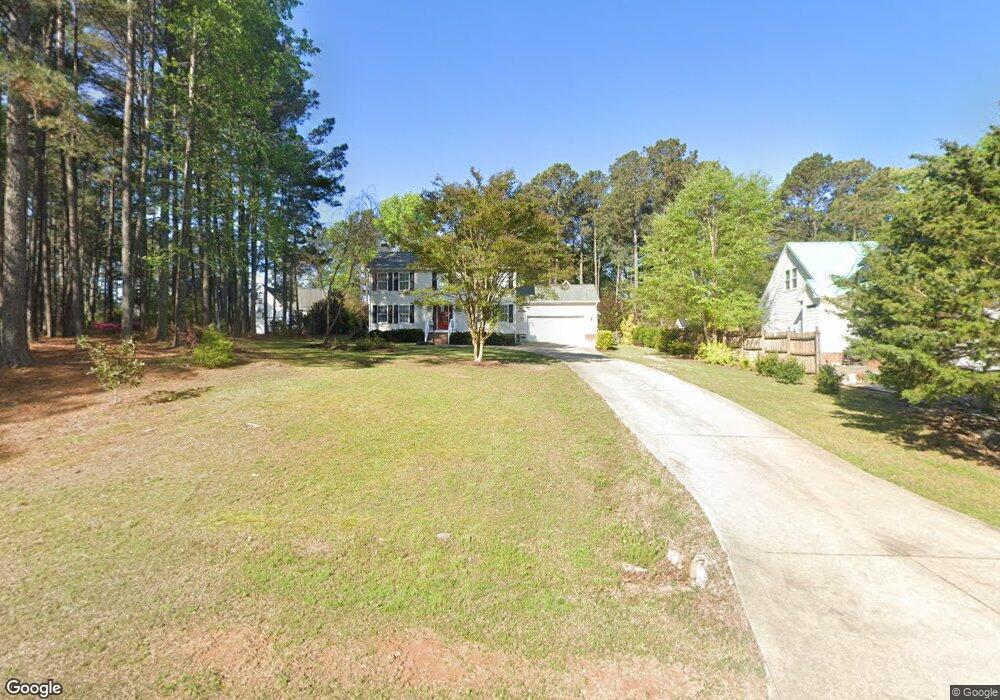
8316 Candlelight Oaks Ln Raleigh, NC 27603
Estimated Value: $452,000 - $507,000
4
Beds
3
Baths
2,080
Sq Ft
$228/Sq Ft
Est. Value
About This Home
This home is located at 8316 Candlelight Oaks Ln, Raleigh, NC 27603 and is currently estimated at $474,303, approximately $228 per square foot. 8316 Candlelight Oaks Ln is a home located in Wake County with nearby schools including Rand Road Elementary, North Garner Middle, and South Garner High.
Ownership History
Date
Name
Owned For
Owner Type
Purchase Details
Closed on
Dec 11, 2012
Sold by
Aumiller Properties Inc
Bought by
Castelli Timothy J and Castelli Angela Caroline
Current Estimated Value
Home Financials for this Owner
Home Financials are based on the most recent Mortgage that was taken out on this home.
Original Mortgage
$185,576
Outstanding Balance
$127,845
Interest Rate
3.25%
Mortgage Type
FHA
Estimated Equity
$346,458
Purchase Details
Closed on
Mar 1, 2012
Sold by
Fannie Mae
Bought by
Aumiller Properties Inc
Purchase Details
Closed on
Nov 29, 2011
Sold by
Denton Deborah I and Denton Deborah
Bought by
Federal National Mortgage Association
Purchase Details
Closed on
Jul 23, 1998
Sold by
Nottingham Forest Inc
Bought by
Denton Elliott M and Denton Deborah I
Home Financials for this Owner
Home Financials are based on the most recent Mortgage that was taken out on this home.
Original Mortgage
$140,650
Interest Rate
6.94%
Create a Home Valuation Report for This Property
The Home Valuation Report is an in-depth analysis detailing your home's value as well as a comparison with similar homes in the area
Home Values in the Area
Average Home Value in this Area
Purchase History
| Date | Buyer | Sale Price | Title Company |
|---|---|---|---|
| Castelli Timothy J | $189,000 | None Available | |
| Aumiller Properties Inc | -- | None Available | |
| Federal National Mortgage Association | -- | Us Title | |
| Denton Elliott M | $28,000 | -- |
Source: Public Records
Mortgage History
| Date | Status | Borrower | Loan Amount |
|---|---|---|---|
| Open | Castelli Timothy J | $185,576 | |
| Previous Owner | Denton Elliott M | $140,650 |
Source: Public Records
Tax History Compared to Growth
Tax History
| Year | Tax Paid | Tax Assessment Tax Assessment Total Assessment is a certain percentage of the fair market value that is determined by local assessors to be the total taxable value of land and additions on the property. | Land | Improvement |
|---|---|---|---|---|
| 2025 | $3,184 | $494,623 | $140,000 | $354,623 |
| 2024 | $3,092 | $494,623 | $140,000 | $354,623 |
| 2023 | $2,474 | $314,687 | $50,000 | $264,687 |
| 2022 | $2,293 | $314,687 | $50,000 | $264,687 |
| 2021 | $2,231 | $314,687 | $50,000 | $264,687 |
| 2020 | $2,194 | $314,687 | $50,000 | $264,687 |
| 2019 | $1,988 | $240,914 | $44,000 | $196,914 |
| 2018 | $1,599 | $210,474 | $44,000 | $166,474 |
| 2017 | $1,516 | $210,474 | $44,000 | $166,474 |
| 2016 | $1,486 | $210,474 | $44,000 | $166,474 |
| 2015 | $1,481 | $210,312 | $44,000 | $166,312 |
| 2014 | $1,404 | $210,312 | $44,000 | $166,312 |
Source: Public Records
Map
Nearby Homes
- 920 Shadywood Ln
- 1116 Shadywood Ln
- 9505 Neils Branch Rd
- 10001 Joe Leach Rd
- 701 Rand Rd
- 4117 Bashford Bluffs Ln
- 5013 Contender Dr
- 8500 Old Ponderosa Cir
- 700 Arbor Greene Dr
- 4721 Sandy Bay Cir
- 9017 Hunterfox Ct
- 316 Arbor Greene Dr
- 8001 Lakeshore Dr
- 901 Edgewater Dr
- 1101 Robinfield Dr
- 1004 Cabin Hill Way
- 212 Bluefield Dr
- 449 Kings Hollow Dr
- 1009 Feldmen Dr
- 221 Sprenger St
- 8312 Candlelight Oaks Ln
- 8320 Candlelight Oaks Ln
- 4809 Topstone Rd
- 8308 Candlelight Oaks Ln
- 4813 Topstone Rd
- 4805 Topstone Rd
- 8313 Candlelight Oaks Ln
- 4817 Topstone Rd
- 4801 Topstone Rd
- 8304 Candlelight Oaks Ln
- 8305 Candlelight Oaks Ln
- 4821 Topstone Rd
- 4800 Topstone Rd
- 4800 Top Stone Rd
- 4808 Topstone Rd
- 4800 Topstone Rd
- 904 Shadywood Ln
- 4825 Topstone Rd
- 908 Shadywood Ln
- 1016 Rockwell Ct