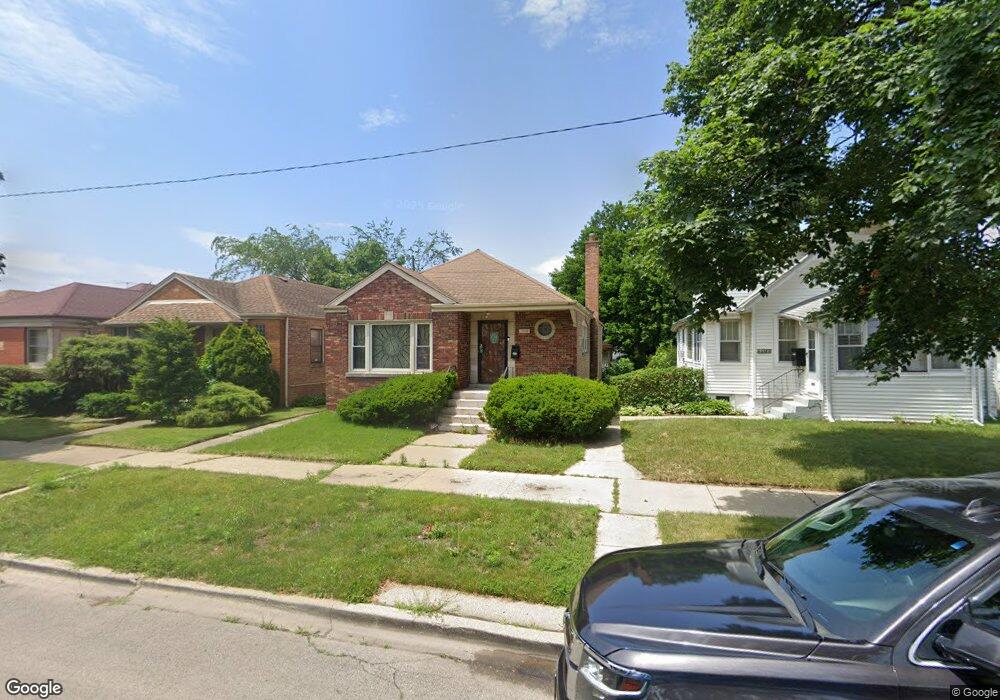
8318 S Blackstone Ave Chicago, IL 60619
Calumet Heights NeighborhoodEstimated Value: $200,966 - $237,000
3
Beds
3
Baths
1,441
Sq Ft
$151/Sq Ft
Est. Value
About This Home
This home is located at 8318 S Blackstone Ave, Chicago, IL 60619 and is currently estimated at $217,242, approximately $150 per square foot. 8318 S Blackstone Ave is a home located in Cook County with nearby schools including Caldwell Elementary Academy, Mcdowell Elementary School, and CICS Avalon.
Ownership History
Date
Name
Owned For
Owner Type
Purchase Details
Closed on
Aug 14, 2025
Sold by
Home Rehab Llc
Bought by
Kr Capital Llc
Current Estimated Value
Purchase Details
Closed on
Aug 8, 2025
Sold by
Evans Ontario
Bought by
Home Rehab Llc
Purchase Details
Closed on
Jul 8, 2025
Sold by
Dodd-Kavipurapu Karetha
Bought by
Evans Ontario
Purchase Details
Closed on
Jun 24, 2025
Sold by
Evans Harold
Bought by
Evans Ontario
Purchase Details
Closed on
Dec 15, 2023
Sold by
Evans Harold
Bought by
Evans Ontario
Purchase Details
Closed on
Aug 18, 2015
Sold by
Evans Theora
Bought by
Evans Harold
Purchase Details
Closed on
May 7, 2015
Sold by
Randolph John Henry
Bought by
Evans Theora
Purchase Details
Closed on
Feb 25, 2015
Sold by
Evans Harold and Evans Theora
Bought by
Evans Harold and Estate Of Alice Rattray
Purchase Details
Closed on
Sep 24, 2008
Sold by
Rattray Alice L
Bought by
Rattray Alice L and Rattray Trust #001
Create a Home Valuation Report for This Property
The Home Valuation Report is an in-depth analysis detailing your home's value as well as a comparison with similar homes in the area
Home Values in the Area
Average Home Value in this Area
Purchase History
| Date | Buyer | Sale Price | Title Company |
|---|---|---|---|
| Kr Capital Llc | $128,000 | None Listed On Document | |
| Home Rehab Llc | $82,000 | Chicago Title Insurance Compan | |
| Evans Ontario | -- | Chicago Title Insurance Compan | |
| Evans Ontario | -- | Chicago Title Insurance Compan | |
| Evans Ontario | -- | None Listed On Document | |
| Evans Harold | -- | Attorney | |
| Evans Theora | -- | None Available | |
| Evans Harold | -- | None Available | |
| Rattray Alice L | -- | None Available |
Source: Public Records
Tax History Compared to Growth
Tax History
| Year | Tax Paid | Tax Assessment Tax Assessment Total Assessment is a certain percentage of the fair market value that is determined by local assessors to be the total taxable value of land and additions on the property. | Land | Improvement |
|---|---|---|---|---|
| 2024 | $2,542 | $14,157 | $2,344 | $11,813 |
| 2023 | $2,478 | $12,047 | $3,906 | $8,141 |
| 2022 | $2,478 | $12,047 | $3,906 | $8,141 |
| 2021 | $2,422 | $12,046 | $3,906 | $8,140 |
| 2020 | $2,381 | $10,688 | $2,812 | $7,876 |
| 2019 | $2,394 | $11,914 | $2,812 | $9,102 |
| 2018 | $2,353 | $11,914 | $2,812 | $9,102 |
| 2017 | $2,867 | $13,316 | $2,500 | $10,816 |
| 2016 | $2,667 | $13,316 | $2,500 | $10,816 |
| 2015 | $2,440 | $13,316 | $2,500 | $10,816 |
| 2014 | $2,387 | $12,867 | $2,187 | $10,680 |
| 2013 | $2,340 | $12,867 | $2,187 | $10,680 |
Source: Public Records
Map
Nearby Homes
- 8325 S Dante Ave
- 8200 S Harper Ave
- 8344 S Blackstone Ave
- 8344 S Stony Island Ave
- 8138 S Harper Ave
- 8429 S Dante Ave
- 8106 S Harper Ave
- 8250 S Kenwood Ave
- 8211 S Cornell Ave
- 7521 S Kimbark Ave
- 1707 E 83rd St
- 8041 S Blackstone Ave
- 8129 S Cornell Ave
- 1706 E 83rd St
- 8035 S Blackstone Ave
- 1523 E 85th St
- 8510 S Blackstone Ave
- 8114 S Anthony Ave
- 8227 S Avalon Ave
- 8101 S Kimbark Ave
- 8316 S Blackstone Ave
- 8322 S Blackstone Ave
- 8314 S Blackstone Ave
- 8326 S Blackstone Ave
- 8328 S Blackstone Ave
- 8332 S Blackstone Ave
- 1453 E 83rd St
- 8319 S Dante Ave
- 1449 E 83rd St
- 8304 S Blackstone Ave
- 1447 E 83rd St
- 8334 S Blackstone Ave
- 8329 S Dante Ave
- 8331 S Dante Ave
- 1443 E 83rd St
- 8338 S Blackstone Ave
- 1501 E 83rd St
- 8335 S Dante Ave
- 1439 E 83rd St
- 8340 S Blackstone Ave