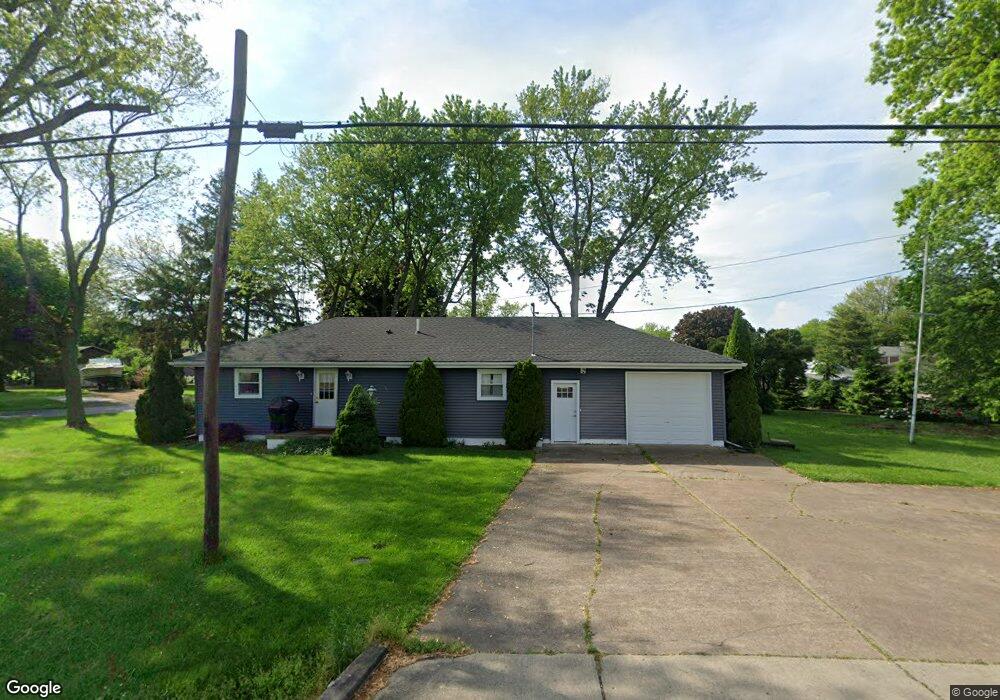
8319 E Northshore Blvd Lakeside Marblehead, OH 43440
Estimated Value: $330,702 - $391,000
3
Beds
2
Baths
1,440
Sq Ft
$250/Sq Ft
Est. Value
About This Home
This home is located at 8319 E Northshore Blvd, Lakeside Marblehead, OH 43440 and is currently estimated at $359,426, approximately $249 per square foot. 8319 E Northshore Blvd is a home located in Ottawa County with nearby schools including Danbury Middle School and Danbury High School.
Ownership History
Date
Name
Owned For
Owner Type
Purchase Details
Closed on
Feb 25, 2009
Sold by
Lenthe Megan and Lenthe David
Bought by
Hansen Lill Fosli and The Lill Fosli Hansen Revocable Living T
Current Estimated Value
Purchase Details
Closed on
Feb 14, 2006
Sold by
Keubler Jacob
Bought by
Keubler Megan
Home Financials for this Owner
Home Financials are based on the most recent Mortgage that was taken out on this home.
Original Mortgage
$110,500
Interest Rate
7.75%
Mortgage Type
Stand Alone First
Purchase Details
Closed on
Feb 20, 2001
Sold by
Trst Dorothy Coury
Bought by
Keubler Jacob and Keubler Megan
Home Financials for this Owner
Home Financials are based on the most recent Mortgage that was taken out on this home.
Original Mortgage
$58,200
Interest Rate
7.1%
Mortgage Type
New Conventional
Create a Home Valuation Report for This Property
The Home Valuation Report is an in-depth analysis detailing your home's value as well as a comparison with similar homes in the area
Home Values in the Area
Average Home Value in this Area
Purchase History
| Date | Buyer | Sale Price | Title Company |
|---|---|---|---|
| Hansen Lill Fosli | $125,000 | Hartung Title | |
| Keubler Megan | -- | Attorney | |
| Keubler Jacob | $60,000 | -- |
Source: Public Records
Mortgage History
| Date | Status | Borrower | Loan Amount |
|---|---|---|---|
| Previous Owner | Keubler Megan | $110,500 | |
| Previous Owner | Keubler Jacob | $58,200 |
Source: Public Records
Tax History
| Year | Tax Paid | Tax Assessment Tax Assessment Total Assessment is a certain percentage of the fair market value that is determined by local assessors to be the total taxable value of land and additions on the property. | Land | Improvement |
|---|---|---|---|---|
| 2024 | $3,191 | $95,281 | $48,829 | $46,452 |
| 2023 | $3,178 | $69,500 | $32,550 | $36,950 |
| 2022 | $2,347 | $69,500 | $32,550 | $36,950 |
| 2021 | $2,354 | $69,500 | $32,550 | $36,950 |
| 2020 | $2,351 | $65,650 | $31,910 | $33,740 |
| 2019 | $2,170 | $65,650 | $31,910 | $33,740 |
| 2018 | $2,392 | $65,650 | $31,910 | $33,740 |
| 2017 | $1,851 | $48,760 | $18,240 | $30,520 |
| 2016 | $1,834 | $48,760 | $18,240 | $30,520 |
| 2015 | $1,845 | $48,760 | $18,240 | $30,520 |
| 2014 | $941 | $48,760 | $18,240 | $30,520 |
| 2013 | $1,761 | $48,760 | $18,240 | $30,520 |
Source: Public Records
Map
Nearby Homes
- 8175 E Northshore Blvd Unit 15
- 8175 N Shore Blvd Unit 9
- 8175 N Shore Blvd Unit 20
- 271 Willowdale Dr
- 269 N Lighthouse Oval
- 8335 E Reserve Way
- 347 Hidden Beach Rd
- 8260 E Lake Blvd
- 242 N Worthy St
- 2396 Yacht Club Ln
- 2334 Yacht Club Ln
- 0 S Harbor Bay Dr Unit 20210331
- 1 Downend
- 2 Downend
- 273 N Lighthouse Oval
- Evora Plan at Lighthouse Bluffs
- 281 N Lighthouse Oval
- 275 N Lighthouse Oval
- Macon Plan at Lighthouse Bluffs
- Raleigh II Plan at Lighthouse Bluffs
- 191 N Arman Rd
- 8300 E North Shore
- 178 N Arman Rd
- 8287 E Northshore Blvd
- 8287 E North Shore Blvd
- 8349 E Northshore Blvd
- 8348 E Northshore Blvd
- 203 N Arman Rd
- 200 N Arman Rd
- 185 N Christopher Dr
- 197 N Christopher Dr
- 203 N Christopher Dr
- 112 N Margaret Dr
- 8300 E Northshore Blvd
- 141 N Margaret Dr
- 214 N Margaret Dr
- 208 N Arman Rd
- 131 N Margaret Dr
- 151 N Margaret Dr
- 221 N Arman Rd
Your Personal Tour Guide
Ask me questions while you tour the home.