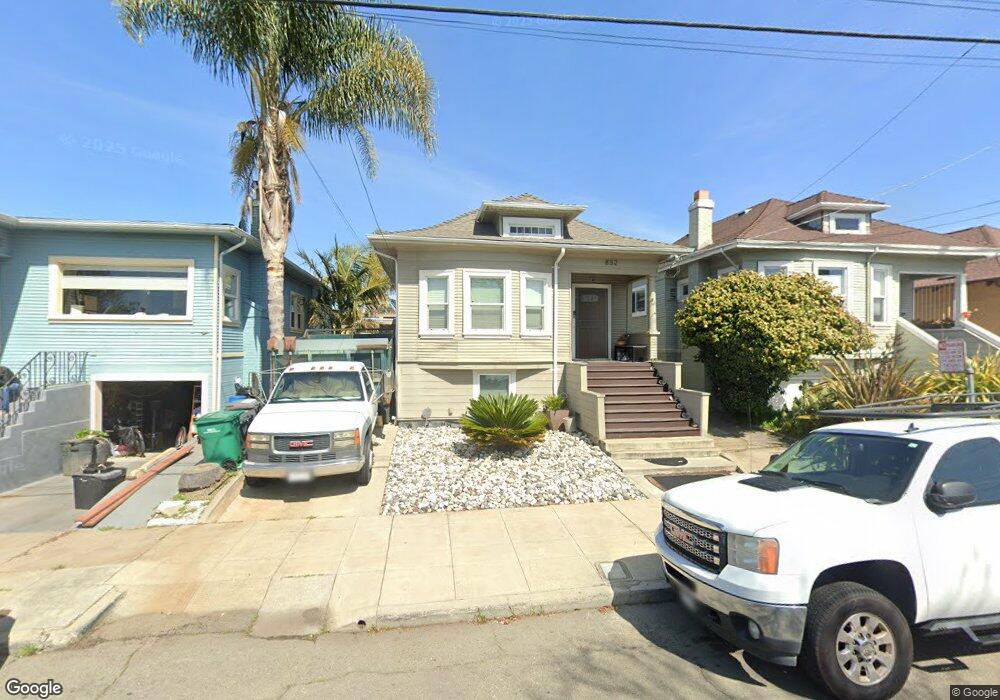
832 43rd St Emeryville, CA 94608
Longfellow NeighborhoodEstimated Value: $821,000 - $1,034,000
5
Beds
3
Baths
1,919
Sq Ft
$481/Sq Ft
Est. Value
About This Home
This home is located at 832 43rd St, Emeryville, CA 94608 and is currently estimated at $922,599, approximately $480 per square foot. 832 43rd St is a home located in Alameda County with nearby schools including Emerson Elementary School, Claremont Middle School, and Oakland Technical High School.
Ownership History
Date
Name
Owned For
Owner Type
Purchase Details
Closed on
Feb 6, 2023
Sold by
Dejean Lisa Marta
Bought by
Lisa Marta Dejean Trust
Current Estimated Value
Purchase Details
Closed on
Feb 11, 2008
Sold by
Ford Sadie Marie
Bought by
Dejean Lisa Marta
Create a Home Valuation Report for This Property
The Home Valuation Report is an in-depth analysis detailing your home's value as well as a comparison with similar homes in the area
Home Values in the Area
Average Home Value in this Area
Purchase History
| Date | Buyer | Sale Price | Title Company |
|---|---|---|---|
| Lisa Marta Dejean Trust | -- | -- | |
| Dejean Lisa Marta | -- | None Available |
Source: Public Records
Tax History Compared to Growth
Tax History
| Year | Tax Paid | Tax Assessment Tax Assessment Total Assessment is a certain percentage of the fair market value that is determined by local assessors to be the total taxable value of land and additions on the property. | Land | Improvement |
|---|---|---|---|---|
| 2025 | $4,483 | $212,481 | $64,665 | $147,816 |
| 2024 | $4,483 | $208,316 | $63,398 | $144,918 |
| 2023 | $4,609 | $204,232 | $62,155 | $142,077 |
| 2022 | $4,434 | $200,227 | $60,936 | $139,291 |
| 2021 | $4,122 | $196,302 | $59,741 | $136,561 |
| 2020 | $4,076 | $194,290 | $59,129 | $135,161 |
| 2019 | $3,849 | $190,482 | $57,970 | $132,512 |
| 2018 | $3,773 | $186,748 | $56,833 | $129,915 |
| 2017 | $3,602 | $183,087 | $55,719 | $127,368 |
| 2016 | $3,414 | $179,496 | $54,626 | $124,870 |
| 2015 | $3,393 | $176,801 | $53,806 | $122,995 |
| 2014 | $3,346 | $173,338 | $52,752 | $120,586 |
Source: Public Records
Map
Nearby Homes