
Landlord's Agent in 2020
Jonathan Ashbridge
Keller Williams Realty
(781) 608-5007
98 Total Sales
Estimated Value: $581,000 - $727,000
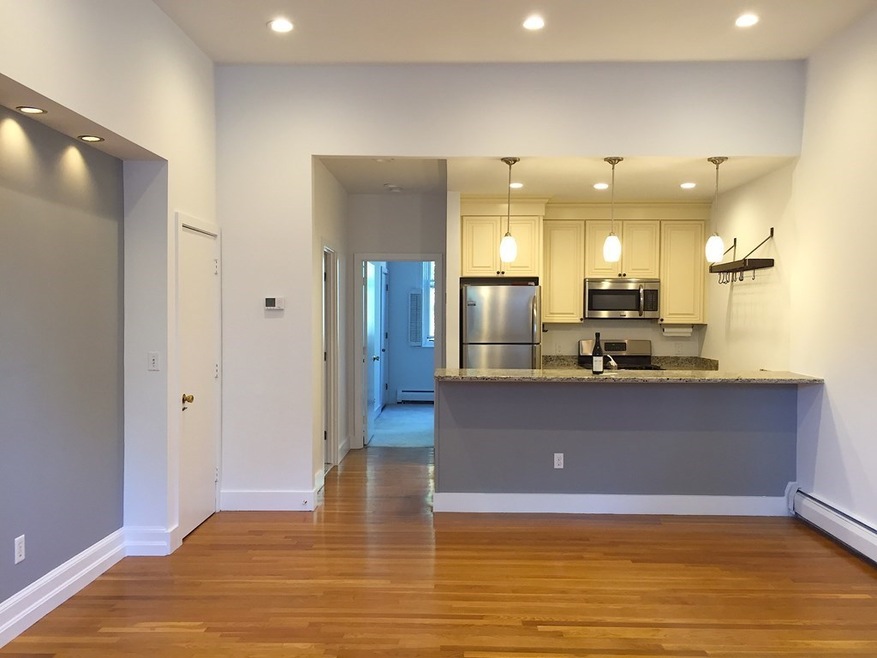
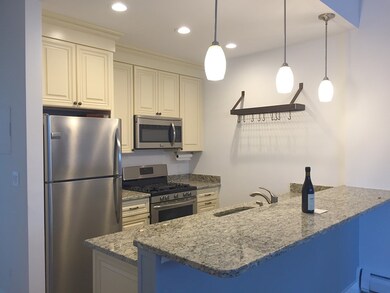
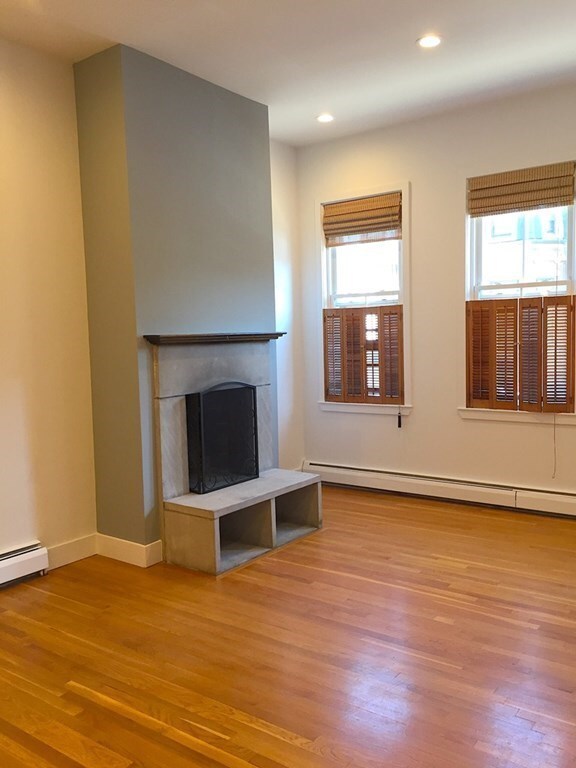
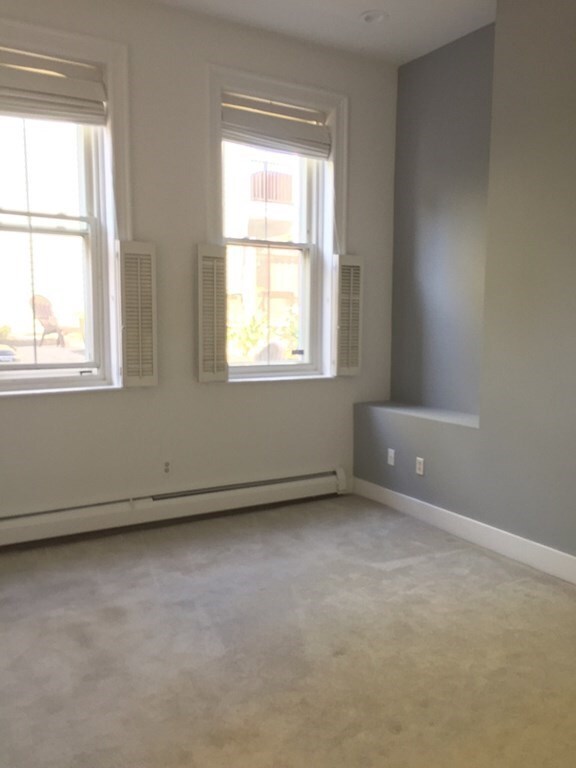
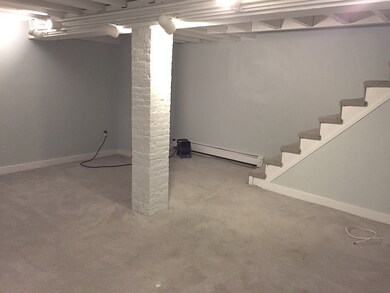
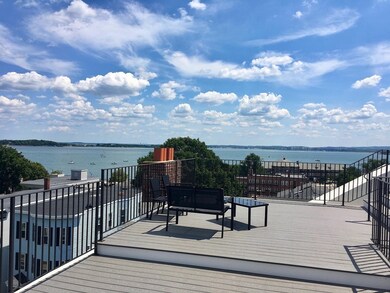
Available for 9/1; 9/15 OR 10/1. Premier EAST SIDE LOCATION! Less than a block from coveted Farragut Road, this Brick Brownstone building offers a King Size master bedroom, finished basement (great for office or living room), Great storage, hardwoods & IN-UNIT laundry. Modern granite & stainless kitchen w/breakfast bar, great natural light, open floor plan. Double wide common roof deck with amazing panoramic views of the ocean, city skyline and nearby Castle Island. If you'd prefer something more quaint, there is a lovely landscaped patio common area nestled in back, great for grilling and entertaining. Easy access to downtown with the #7, 10 & 11 buses moments away. Just two blocks to the Beach & Castle Island/Pleasure Bay. HEAT INCLUDED! Landlord would consider one small pet for an additional $50/month(ask about)
| Date | Event | Price | List to Sale | Price per Sq Ft | Prior Sale |
|---|---|---|---|---|---|
| 09/15/2020 09/15/20 | Rented | $2,300 | 0.0% | -- | |
| 09/05/2020 09/05/20 | Under Contract | -- | -- | -- | |
| 08/25/2020 08/25/20 | Price Changed | $2,300 | -8.0% | $2 / Sq Ft | |
| 08/10/2020 08/10/20 | Price Changed | $2,500 | -5.7% | $2 / Sq Ft | |
| 07/10/2020 07/10/20 | For Rent | $2,650 | +6.0% | -- | |
| 09/01/2018 09/01/18 | Rented | $2,500 | 0.0% | -- | |
| 08/09/2018 08/09/18 | Under Contract | -- | -- | -- | |
| 07/31/2018 07/31/18 | For Rent | $2,500 | 0.0% | -- | |
| 07/29/2017 07/29/17 | Rented | $2,500 | 0.0% | -- | |
| 06/20/2017 06/20/17 | Under Contract | -- | -- | -- | |
| 06/15/2017 06/15/17 | For Rent | $2,500 | 0.0% | -- | |
| 06/29/2012 06/29/12 | Sold | $270,000 | -3.2% | $419 / Sq Ft | View Prior Sale |
| 05/26/2012 05/26/12 | Pending | -- | -- | -- | |
| 04/19/2012 04/19/12 | For Sale | $279,000 | -- | $433 / Sq Ft |
| Year | Tax Paid | Tax Assessment Tax Assessment Total Assessment is a certain percentage of the fair market value that is determined by local assessors to be the total taxable value of land and additions on the property. | Land | Improvement |
|---|---|---|---|---|
| 2025 | $6,002 | $518,300 | $0 | $518,300 |
| 2024 | $6,029 | $553,100 | $0 | $553,100 |
| 2023 | $5,820 | $541,900 | $0 | $541,900 |
| 2022 | $5,668 | $521,000 | $0 | $521,000 |
| 2021 | $5,449 | $510,700 | $0 | $510,700 |
| 2020 | $4,736 | $448,500 | $0 | $448,500 |
| 2019 | $4,419 | $419,300 | $0 | $419,300 |
| 2018 | $4,185 | $399,300 | $0 | $399,300 |
| 2017 | $3,952 | $373,200 | $0 | $373,200 |
| 2016 | $4,032 | $366,500 | $0 | $366,500 |
| 2015 | $4,295 | $354,700 | $0 | $354,700 |
| 2014 | $3,983 | $316,600 | $0 | $316,600 |
Landlord's Agent in 2020
Jonathan Ashbridge
Keller Williams Realty
(781) 608-5007
98 Total Sales
A
Buyer's Agent in 2018
Amanda Johnston
Compass
Seller's Agent in 2012
Joyce Lebedew
Joyce Lebedew Real Estate
(617) 594-1449
96 in this area
101 Total Sales
M
Buyer's Agent in 2012
Max Vigliotti
Compass
Source: MLS Property Information Network (MLS PIN)
MLS Number: 72688892
APN: SBOS-000000-000006-004474-000004
Disclaimer: Certain information contained herein is derived from information provided by parties other than Homes.com. All information provided is deemed reliable, but is not guaranteed to be accurate and should be independently verified.
![]() The property listing data and information, or the Images, set forth herein were provided to MLS Property Information Network, Inc. from third party sources, including sellers, lessors and public records, and were compiled by MLS Property Information Network, Inc. The property listing data and information, and the Images, are for the personal, non-commercial use of consumers having a good faith interest in purchasing or leasing listed properties of the type displayed to them and may not be used for any purpose other than to identify prospective properties which such consumers may have a good faith interest in purchasing or leasing. MLS Property Information Network, Inc. and its subscribers disclaim any and all representations and warranties as to the accuracy of the property listing data and information, or as to the accuracy of any of the Images, set forth herein.
The property listing data and information, or the Images, set forth herein were provided to MLS Property Information Network, Inc. from third party sources, including sellers, lessors and public records, and were compiled by MLS Property Information Network, Inc. The property listing data and information, and the Images, are for the personal, non-commercial use of consumers having a good faith interest in purchasing or leasing listed properties of the type displayed to them and may not be used for any purpose other than to identify prospective properties which such consumers may have a good faith interest in purchasing or leasing. MLS Property Information Network, Inc. and its subscribers disclaim any and all representations and warranties as to the accuracy of the property listing data and information, or as to the accuracy of any of the Images, set forth herein.
Ask me questions while you tour the home.