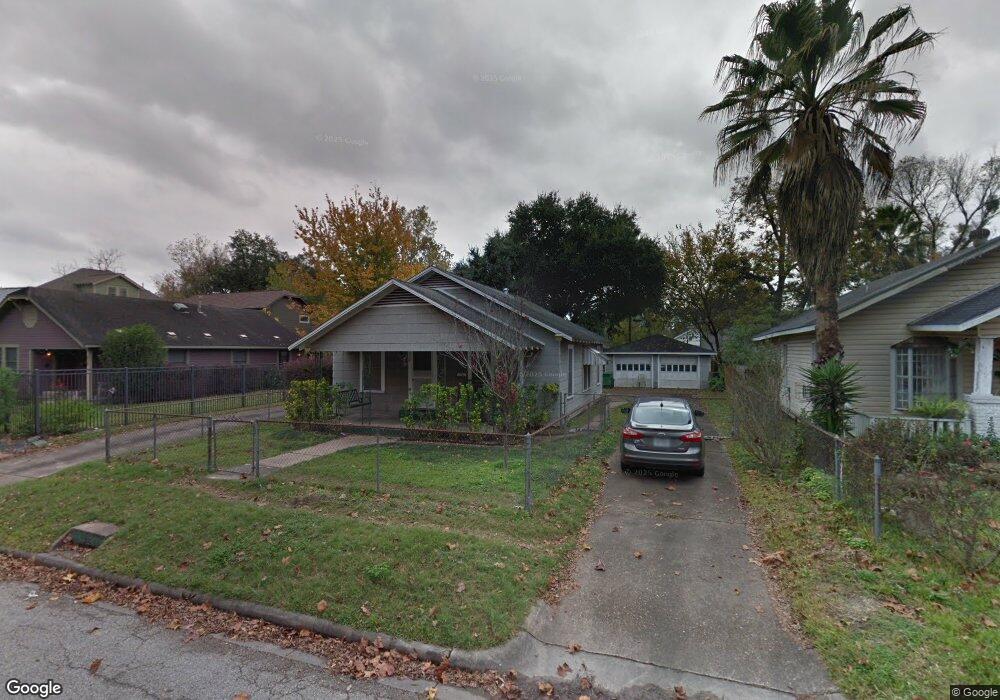
832 Aurora St Houston, TX 77009
Greater Heights NeighborhoodEstimated Value: $445,990 - $597,000
2
Beds
1
Bath
1,136
Sq Ft
$442/Sq Ft
Est. Value
About This Home
This home is located at 832 Aurora St, Houston, TX 77009 and is currently estimated at $502,248, approximately $442 per square foot. 832 Aurora St is a home located in Harris County with nearby schools including Field Elementary School, Hamilton Middle, and Heights High School.
Ownership History
Date
Name
Owned For
Owner Type
Purchase Details
Closed on
Nov 27, 2002
Sold by
Winfield Larry D and Slaughter Jessie Campbell
Bought by
Winfield Larry D
Current Estimated Value
Purchase Details
Closed on
Apr 2, 1999
Sold by
Lee Robert R and Lee Patricia M
Bought by
Schooler Joel Kelly
Home Financials for this Owner
Home Financials are based on the most recent Mortgage that was taken out on this home.
Original Mortgage
$63,650
Outstanding Balance
$15,823
Interest Rate
6.82%
Estimated Equity
$486,425
Create a Home Valuation Report for This Property
The Home Valuation Report is an in-depth analysis detailing your home's value as well as a comparison with similar homes in the area
Home Values in the Area
Average Home Value in this Area
Purchase History
| Date | Buyer | Sale Price | Title Company |
|---|---|---|---|
| Winfield Larry D | -- | -- | |
| Schooler Joel Kelly | -- | Commonwealth Land Title Co |
Source: Public Records
Mortgage History
| Date | Status | Borrower | Loan Amount |
|---|---|---|---|
| Open | Schooler Joel Kelly | $63,650 |
Source: Public Records
Tax History Compared to Growth
Tax History
| Year | Tax Paid | Tax Assessment Tax Assessment Total Assessment is a certain percentage of the fair market value that is determined by local assessors to be the total taxable value of land and additions on the property. | Land | Improvement |
|---|---|---|---|---|
| 2025 | $398 | $479,455 | $450,000 | $29,455 |
| 2024 | $398 | $420,100 | $420,000 | $100 |
| 2023 | $398 | $422,760 | $420,000 | $2,760 |
| 2022 | $6,900 | $392,914 | $360,000 | $32,914 |
| 2021 | $6,640 | $322,012 | $288,000 | $34,012 |
| 2020 | $6,271 | $308,111 | $288,000 | $20,111 |
| 2019 | $5,958 | $318,400 | $288,000 | $30,400 |
| 2018 | $973 | $287,000 | $270,000 | $17,000 |
| 2017 | $4,920 | $287,000 | $270,000 | $17,000 |
| 2016 | $4,473 | $255,000 | $240,000 | $15,000 |
| 2015 | $1,160 | $267,874 | $240,000 | $27,874 |
| 2014 | $1,160 | $207,874 | $180,000 | $27,874 |
Source: Public Records
Map
Nearby Homes