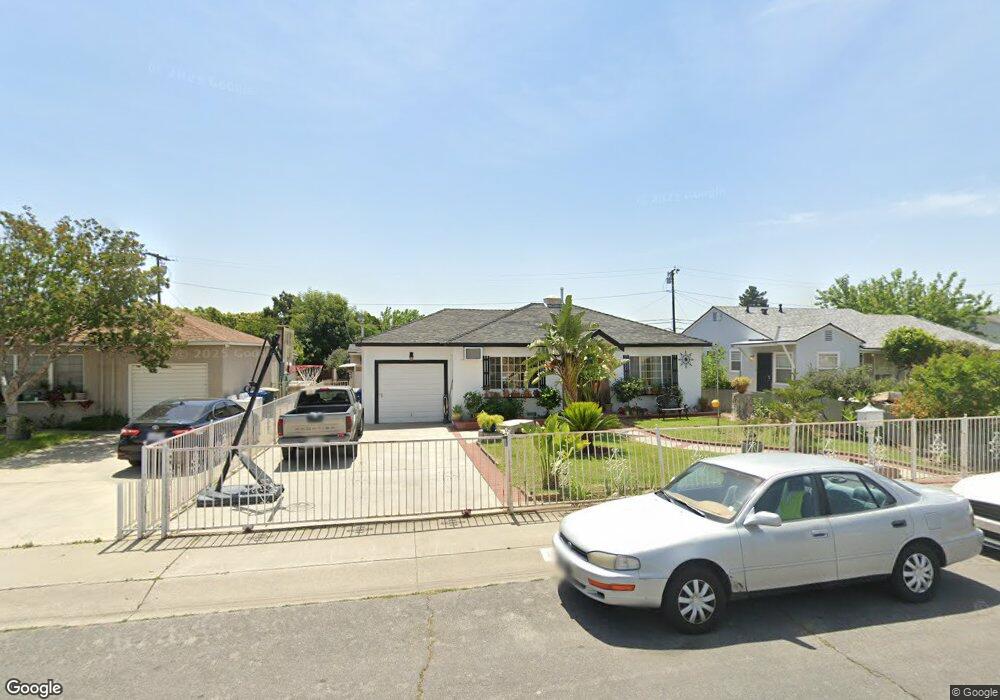
832 E El Morado Ct Ontario, CA 91764
Downtown Ontario NeighborhoodEstimated Value: $541,000 - $595,000
2
Beds
1
Bath
806
Sq Ft
$691/Sq Ft
Est. Value
About This Home
This home is located at 832 E El Morado Ct, Ontario, CA 91764 and is currently estimated at $557,307, approximately $691 per square foot. 832 E El Morado Ct is a home located in San Bernardino County with nearby schools including Berlyn Elementary, Vina Danks Middle, and Chaffey High School.
Ownership History
Date
Name
Owned For
Owner Type
Purchase Details
Closed on
May 30, 2003
Sold by
Dingle Maria R
Bought by
Garcia Carlos and Garcia Maria Teresa
Current Estimated Value
Home Financials for this Owner
Home Financials are based on the most recent Mortgage that was taken out on this home.
Original Mortgage
$109,000
Interest Rate
5.61%
Mortgage Type
Purchase Money Mortgage
Purchase Details
Closed on
Feb 28, 1998
Sold by
Us Bank National Assn
Bought by
Garcia Carlos and Garcia Maria Teresa
Home Financials for this Owner
Home Financials are based on the most recent Mortgage that was taken out on this home.
Original Mortgage
$85,941
Interest Rate
7.07%
Mortgage Type
FHA
Purchase Details
Closed on
Jul 9, 1997
Sold by
Maya Agustin and Maya Esmeralda
Bought by
First National Bank
Purchase Details
Closed on
Mar 9, 1994
Sold by
Maya Agustin M and Cruz Esmeralda
Bought by
Maya Agustin and Maya Toribia
Create a Home Valuation Report for This Property
The Home Valuation Report is an in-depth analysis detailing your home's value as well as a comparison with similar homes in the area
Home Values in the Area
Average Home Value in this Area
Purchase History
| Date | Buyer | Sale Price | Title Company |
|---|---|---|---|
| Garcia Carlos | -- | North American Title Co | |
| Garcia Carlos | $86,000 | Investors Title Company | |
| Us Bank National Assn | -- | Investors Title Company | |
| First National Bank | $116,348 | Orange Coast Title | |
| Maya Agustin | -- | -- |
Source: Public Records
Mortgage History
| Date | Status | Borrower | Loan Amount |
|---|---|---|---|
| Closed | Garcia Carlos | $109,000 | |
| Previous Owner | Garcia Carlos | $85,941 |
Source: Public Records
Tax History Compared to Growth
Tax History
| Year | Tax Paid | Tax Assessment Tax Assessment Total Assessment is a certain percentage of the fair market value that is determined by local assessors to be the total taxable value of land and additions on the property. | Land | Improvement |
|---|---|---|---|---|
| 2025 | $1,875 | $173,130 | $102,238 | $70,892 |
| 2024 | $1,875 | $169,735 | $100,233 | $69,502 |
| 2023 | $1,823 | $166,407 | $98,268 | $68,139 |
| 2022 | $1,799 | $163,144 | $96,341 | $66,803 |
| 2021 | $1,787 | $159,945 | $94,452 | $65,493 |
| 2020 | $1,756 | $158,305 | $93,484 | $64,821 |
| 2019 | $1,741 | $155,201 | $91,651 | $63,550 |
| 2018 | $1,717 | $152,158 | $89,854 | $62,304 |
| 2017 | $1,656 | $149,174 | $88,092 | $61,082 |
| 2016 | $1,591 | $146,249 | $86,365 | $59,884 |
| 2015 | $1,580 | $144,052 | $85,068 | $58,984 |
| 2014 | $1,531 | $141,231 | $83,402 | $57,829 |
Source: Public Records
Map
Nearby Homes
- 838 E El Morado Ct
- 828 E El Morado Ct
- 822 E El Morado Ct
- 844 E El Morado Ct
- 835 E G St
- 839 E G St
- 829 E G St
- 816 E El Morado Ct
- 823 E G St
- 705 N Allyn Ave
- 833 E El Morado Ct
- 839 E El Morado Ct
- 829 E El Morado Ct
- 817 E G St
- 735 N Allyn Ave
- 810 E El Morado Ct
- 817 E El Morado Ct
- 811 E G St
- 722 N Berlyn Ave
- 720 N Allyn Ave