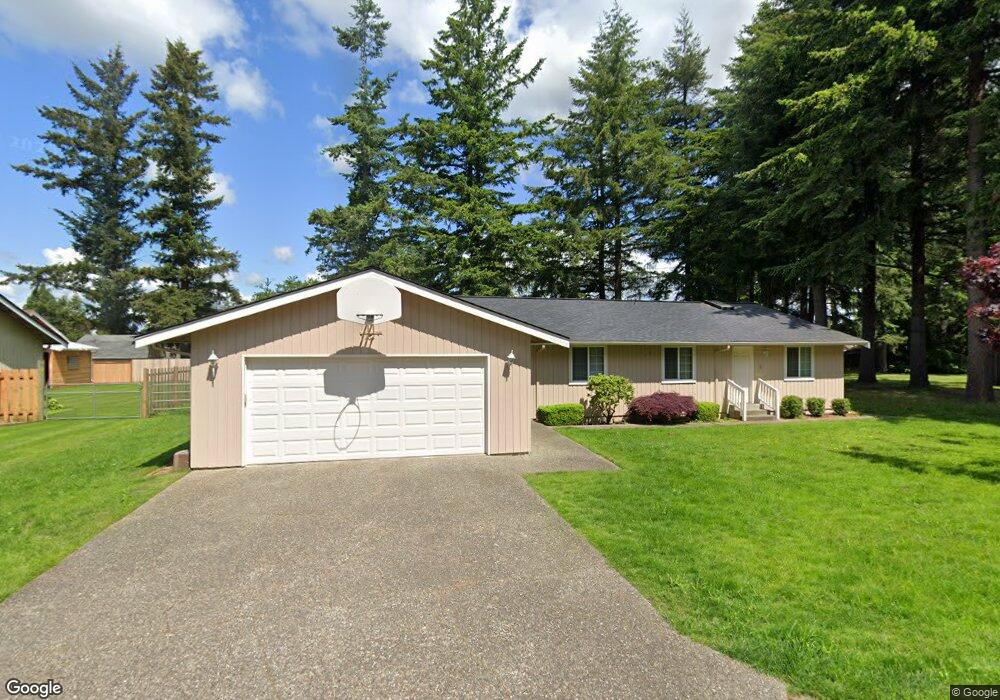
832 Hinotes Ct Lynden, WA 98264
Estimated Value: $660,000 - $962,000
4
Beds
3
Baths
2,220
Sq Ft
$336/Sq Ft
Est. Value
About This Home
This home is located at 832 Hinotes Ct, Lynden, WA 98264 and is currently estimated at $745,655, approximately $335 per square foot. 832 Hinotes Ct is a home located in Whatcom County with nearby schools including Lynden High School, Lynden Christian School, and Lynden Christian Schools: Administration.
Ownership History
Date
Name
Owned For
Owner Type
Purchase Details
Closed on
Aug 19, 2005
Sold by
Sahagun Sharon A
Bought by
Sahagun Carlos E and Sahagun Sharon A
Current Estimated Value
Home Financials for this Owner
Home Financials are based on the most recent Mortgage that was taken out on this home.
Original Mortgage
$44,450
Interest Rate
5.18%
Mortgage Type
Stand Alone Second
Purchase Details
Closed on
Jul 26, 2004
Sold by
Sahagun Carlos E
Bought by
Sahagun Sharon A
Home Financials for this Owner
Home Financials are based on the most recent Mortgage that was taken out on this home.
Original Mortgage
$219,600
Interest Rate
6.29%
Mortgage Type
New Conventional
Purchase Details
Closed on
Dec 26, 2002
Sold by
Rutter Jere M and Rutter Joanne K
Bought by
Sahagun Carlos E and Sahagun Sharon A
Home Financials for this Owner
Home Financials are based on the most recent Mortgage that was taken out on this home.
Original Mortgage
$161,975
Interest Rate
5.86%
Create a Home Valuation Report for This Property
The Home Valuation Report is an in-depth analysis detailing your home's value as well as a comparison with similar homes in the area
Home Values in the Area
Average Home Value in this Area
Purchase History
| Date | Buyer | Sale Price | Title Company |
|---|---|---|---|
| Sahagun Carlos E | -- | Whatcom Land Title | |
| Sahagun Sharon A | -- | Whatcom Land Title | |
| Sahagun Carlos E | $170,500 | Whatcom Land Title |
Source: Public Records
Mortgage History
| Date | Status | Borrower | Loan Amount |
|---|---|---|---|
| Closed | Sahagun Carlos E | $44,450 | |
| Open | Sahagun Carlos E | $226,200 | |
| Previous Owner | Sahagun Sharon A | $219,600 | |
| Previous Owner | Sahagun Carlos E | $161,975 |
Source: Public Records
Tax History Compared to Growth
Tax History
| Year | Tax Paid | Tax Assessment Tax Assessment Total Assessment is a certain percentage of the fair market value that is determined by local assessors to be the total taxable value of land and additions on the property. | Land | Improvement |
|---|---|---|---|---|
| 2024 | $4,398 | $591,413 | $242,500 | $348,913 |
| 2023 | $4,398 | $585,493 | $250,000 | $335,493 |
| 2022 | $3,934 | $489,883 | $153,434 | $336,449 |
| 2021 | $3,862 | $404,857 | $126,803 | $278,054 |
| 2020 | $3,442 | $361,489 | $113,220 | $248,269 |
| 2019 | $3,084 | $331,535 | $103,955 | $227,580 |
| 2018 | $3,355 | $302,354 | $94,699 | $207,655 |
| 2017 | $3,028 | $271,388 | $85,000 | $186,388 |
| 2016 | $2,861 | $260,857 | $79,200 | $181,657 |
| 2015 | $2,550 | $244,875 | $76,176 | $168,699 |
| 2014 | -- | $236,578 | $73,584 | $162,994 |
| 2013 | -- | $234,994 | $72,000 | $162,994 |
Source: Public Records
Map
Nearby Homes
- 6917 Red Ridge Dr
- 7025 Hannegan Rd
- 918 Citadel Dr
- 6732 La Bello Dr
- 7343 Hannegan Rd Unit 2
- 787 E Wiser Lake Rd
- 6864 Blumefield Dr
- 765 van Dyk Rd
- 271 E Bartlett Rd
- 323 E Wiser Lake Rd
- 7062 Guide Meridian Rd Unit 26
- 1383 Ten Mile Rd
- 6830 Vail Dr
- 6818 Vail Dr
- 6852 Dutch Haven Dr
- 0 Old Guide Rd
- 361 W Wiser Lake Rd
- 1822 E Pole Rd
- 210 E Hemmi Rd
- 1817 Central Rd
- 826 Hinotes Ct
- 846 Hinotes Ct
- 839 Meadowlark Dr
- 833 Meadowlark Rd
- 833 Meadowlark Dr
- 820 Hinotes Ct
- 845 Meadowlark Dr
- 827 Meadowlark Dr
- 851 Meadowlark Dr
- 814 Hinotes Ct
- 821 Meadowlark Dr
- 857 Meadowlark Dr
- 860 Hinotes Ct
- 808 Hinotes Ct
- 863 Meadowlark Dr
- 855 Hinotes Ct
- 868 Hinotes Ct
- 802 Hinotes Ct
- 809 Meadowlark Dr
- 869 Meadowlark Dr