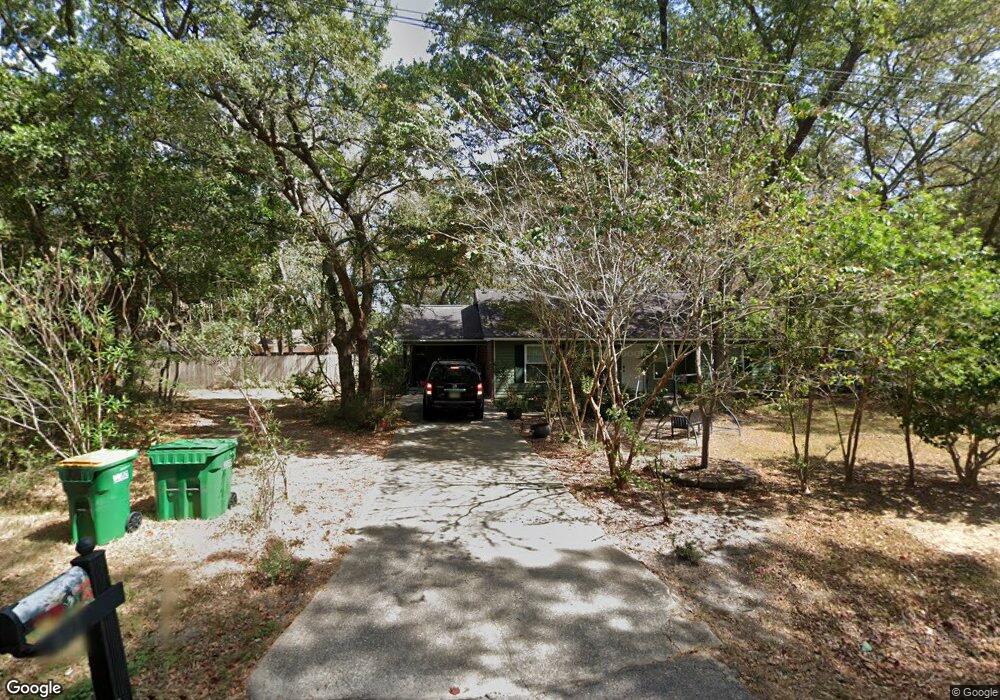
832 Lemon St Ocean Springs, MS 39564
Estimated Value: $126,000 - $180,000
3
Beds
2
Baths
1,176
Sq Ft
$133/Sq Ft
Est. Value
About This Home
This home is located at 832 Lemon St, Ocean Springs, MS 39564 and is currently estimated at $156,867, approximately $133 per square foot. 832 Lemon St is a home located in Jackson County with nearby schools including Pecan Park Elementary School, Ocean Springs Middle School, and Ocean Springs High School.
Ownership History
Date
Name
Owned For
Owner Type
Purchase Details
Closed on
Mar 7, 2025
Sold by
Hunter George Frank
Bought by
Hunter James
Current Estimated Value
Purchase Details
Closed on
Sep 9, 2015
Sold by
Hunter George Frank and Hunter Ruby Jean
Bought by
Hunter George Frank and Hunter Ruby Jean
Purchase Details
Closed on
Jun 12, 2015
Sold by
Vagedes Vagedes Sheena Sheena and Vagedes Hetzel Sheena
Bought by
Hunter George Frank and Hunter Ruby Jean
Purchase Details
Closed on
Dec 26, 2013
Sold by
Hunter George Frank
Bought by
Hunter George Frank and Hunter Ruby Jean
Purchase Details
Closed on
Jul 26, 2012
Sold by
Hunter Ruby Jean
Bought by
Hunter George Frank
Purchase Details
Closed on
Oct 6, 2011
Sold by
Geirge Frank Geirge Frank
Bought by
Hunter Ruby Jean
Purchase Details
Closed on
Dec 15, 2010
Sold by
Federal National Mortgage Association
Bought by
Hunter George Frank
Purchase Details
Closed on
Nov 23, 2010
Sold by
Hunter George Frank
Bought by
Hunter George Frank and Hunter Ruby Jean
Create a Home Valuation Report for This Property
The Home Valuation Report is an in-depth analysis detailing your home's value as well as a comparison with similar homes in the area
Home Values in the Area
Average Home Value in this Area
Purchase History
| Date | Buyer | Sale Price | Title Company |
|---|---|---|---|
| Hunter James | -- | None Listed On Document | |
| Hunter James | -- | None Listed On Document | |
| Hunter George Frank | -- | Pilger Title Co | |
| Hunter George Frank | -- | Pilger Title Co | |
| Hunter George Frank | -- | -- | |
| Hunter George Frank | -- | -- | |
| Hunter Ruby Jean | -- | -- | |
| Hunter George Frank | -- | -- | |
| Hunter George Frank | -- | -- |
Source: Public Records
Tax History Compared to Growth
Tax History
| Year | Tax Paid | Tax Assessment Tax Assessment Total Assessment is a certain percentage of the fair market value that is determined by local assessors to be the total taxable value of land and additions on the property. | Land | Improvement |
|---|---|---|---|---|
| 2024 | $1,302 | $10,104 | $588 | $9,516 |
| 2023 | $1,302 | $10,104 | $588 | $9,516 |
| 2022 | $1,301 | $10,104 | $588 | $9,516 |
| 2021 | $0 | $6,107 | $6,107 | $0 |
| 2020 | $0 | $6,107 | $356 | $5,751 |
| 2019 | $0 | $6,107 | $356 | $5,751 |
| 2018 | $0 | $6,107 | $356 | $5,751 |
| 2017 | $0 | $6,107 | $356 | $5,751 |
| 2016 | $0 | $6,107 | $356 | $5,751 |
| 2015 | -- | $47,660 | $3,090 | $44,570 |
| 2014 | -- | $5,002 | $309 | $4,693 |
| 2013 | -- | $7,504 | $464 | $7,040 |
Source: Public Records
Map
Nearby Homes
- 909 Orange St
- 900 Orange St
- 0 Ocean Beach Estate
- Lot 684 Sycamore
- 808 Orange St
- Lot 2636 Bay St
- 0 Midway St
- 1020 Margaret St
- 0 Dorothy St Unit 4111084
- 00 Gum St
- 0 Juanita St
- Lot 3099 Lynne St
- 1020 May St
- Lot 2633 Sycamore St
- Lot 2634 Sycamore St
- 0 Sycamore St
- 625 Oak St
- 0 S Ash St
- 520 Pine St
- 0 Gum St
- 828 Lemon St
- 905 Orange St
- 901 Orange St
- 837 Orange St
- 913 Orange St
- 0 Lemon St Unit 3256424
- 0 Lemon St Unit 3256421
- 0 Lemon St Unit 3256419
- 0 Lemon St Unit 3266069
- 0 Lemon St Unit 3266058
- 0 Lemon St Unit 3266057
- 0 Lemon St Unit 3268632
- 0 Lemon St Unit 3268630
- 0 Lemon St Unit 3268634
- 0 Lemon St Unit 3271521
- 820 Lemon St
- 917 Orange St
- 0 Orange St
- 816 Lemon St
- 912 Orange St