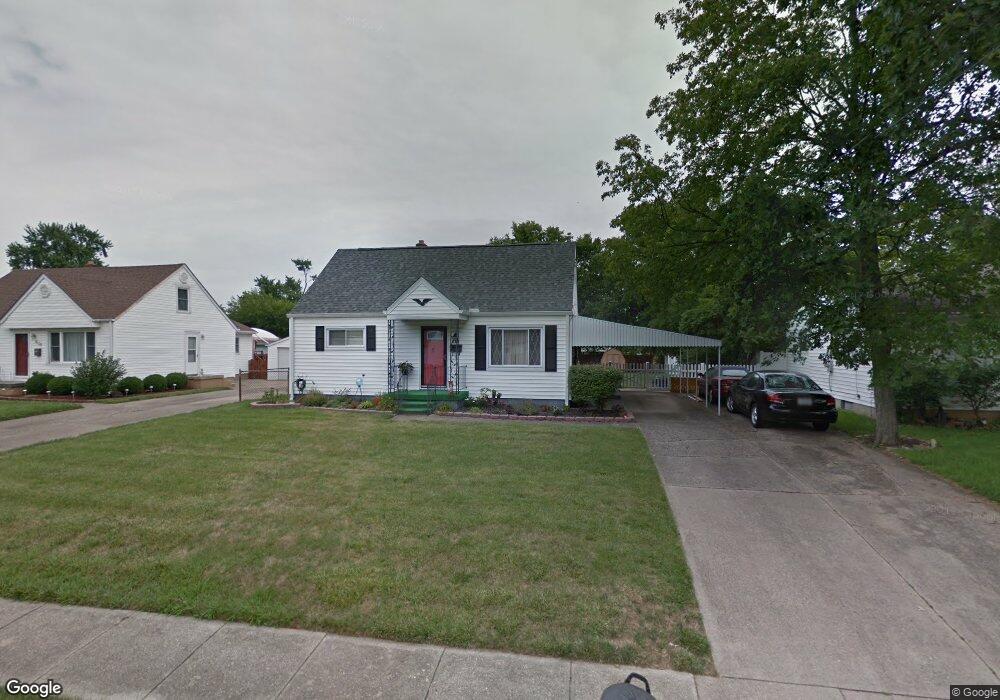
832 Magie Ave Fairfield, OH 45014
Estimated Value: $231,451 - $276,000
3
Beds
1
Bath
1,142
Sq Ft
$220/Sq Ft
Est. Value
About This Home
This home is located at 832 Magie Ave, Fairfield, OH 45014 and is currently estimated at $251,613, approximately $220 per square foot. 832 Magie Ave is a home located in Butler County with nearby schools including Fairfield West Elementary School, Creekside Middle School, and Fairfield Senior High School.
Ownership History
Date
Name
Owned For
Owner Type
Purchase Details
Closed on
Nov 17, 2021
Sold by
Durbin Lori S
Bought by
Durbin Lori J and Durbin Ricci
Current Estimated Value
Home Financials for this Owner
Home Financials are based on the most recent Mortgage that was taken out on this home.
Original Mortgage
$96,000
Outstanding Balance
$81,905
Interest Rate
3.11%
Mortgage Type
New Conventional
Estimated Equity
$169,708
Purchase Details
Closed on
Nov 20, 2013
Sold by
Durbin Lori J and Raquet Lori J
Bought by
Durbin Lori J
Purchase Details
Closed on
Sep 30, 2003
Sold by
Spurlock Nancy
Bought by
Raquet Lori J
Home Financials for this Owner
Home Financials are based on the most recent Mortgage that was taken out on this home.
Original Mortgage
$93,520
Interest Rate
6.4%
Mortgage Type
Purchase Money Mortgage
Create a Home Valuation Report for This Property
The Home Valuation Report is an in-depth analysis detailing your home's value as well as a comparison with similar homes in the area
Home Values in the Area
Average Home Value in this Area
Purchase History
| Date | Buyer | Sale Price | Title Company |
|---|---|---|---|
| Durbin Lori J | -- | Avenue 365 Lender Svcs Llc | |
| Durbin Lori J | -- | None Listed On Document | |
| Durbin Lori J | -- | None Available | |
| Raquet Lori J | $116,900 | -- |
Source: Public Records
Mortgage History
| Date | Status | Borrower | Loan Amount |
|---|---|---|---|
| Open | Durbin Lori J | $96,000 | |
| Closed | Durbin Lori J | $96,000 | |
| Previous Owner | Raquet Lori J | $93,520 |
Source: Public Records
Tax History Compared to Growth
Tax History
| Year | Tax Paid | Tax Assessment Tax Assessment Total Assessment is a certain percentage of the fair market value that is determined by local assessors to be the total taxable value of land and additions on the property. | Land | Improvement |
|---|---|---|---|---|
| 2024 | $2,025 | $54,970 | $11,100 | $43,870 |
| 2023 | $2,015 | $54,970 | $11,100 | $43,870 |
| 2022 | $1,938 | $40,710 | $11,100 | $29,610 |
| 2021 | $1,683 | $40,130 | $11,100 | $29,030 |
| 2020 | $1,751 | $40,130 | $11,100 | $29,030 |
| 2019 | $2,745 | $31,790 | $10,220 | $21,570 |
| 2018 | $1,642 | $31,790 | $10,220 | $21,570 |
| 2017 | $1,658 | $31,790 | $10,220 | $21,570 |
| 2016 | $1,595 | $29,070 | $10,220 | $18,850 |
| 2015 | $1,455 | $29,070 | $10,220 | $18,850 |
| 2014 | $1,594 | $29,070 | $10,220 | $18,850 |
| 2013 | $1,594 | $33,430 | $10,220 | $23,210 |
Source: Public Records
Map
Nearby Homes
- 919 Doris Jane Ave
- 4701 Fairfield Ave
- 4991 Celadon Ave
- 1049 Gail Ave
- 4960 Pleasant Ave
- 5015 Southview Dr
- 4638 Celadon Ave
- 816 Oberlin Dr
- 1005 Oberlin Dr
- 975 Vassar Ct
- 512 Fenwick Dr
- 1129 Doris Jane Ave
- 4918 Holiday Dr
- 4086 Hammond Blvd
- 4095 Kenwood Dr
- 10 Marcel Ct
- 85 Dayspring Dr
- 398 Vinnedge Ave
- 396 Blackburn Ave
- 5887 Olde Winton Ln